Strike Analytics
13 Pivots, Zero Revenue, and the Method That Survived
Four founders raised $125K from friends, family, and personal savings to build an AI analytics platform. Over 14 months we interviewed 50+ people across 20+ cities, built ML pipelines, pivoted 13 times, and never found a paying customer. We ran out of money. This is an honest account of what went wrong, what we built, and what I carried forward into everything I've done since.
The Real Problem
The observation was genuine. Companies were drowning in data but starving for insights. Qualitative research lived in Notion, marketing performance in Google Analytics, support conversations in Intercom, sales data in HubSpot. Nobody could see the connections between them, and by the time teams manually correlated different data types, market conditions had already changed.
We interviewed over 50 people across 20+ cities globally. Product managers, engineering leads, C-level executives, eCommerce operators, agency founders. The gap between what customers said they needed and what they actually did with data was enormous. Most analytics tools could tell you the 'what' but completely missed the 'why' behind user behaviour.
We validated the problem thoroughly. Where we failed was everything that came after.
Four Founders, $125K
We went with four founders deliberately. Bishesh, my CTO who I'd previously worked with at Sesame, was based in Berlin. Georgia came from a product management background with 0-to-1 experience. Tara had a customer success and operations background with a linguistics specialisation — she developed an ontological model that underpinned our AI's language processing. I owned design, product strategy, and eventually most of the go-to-market.
The logic was that four founders could cover more ground than two. Between us we had design, engineering, product, operations, and linguistics. We thought that cross-functional coverage would compensate for having no money. It didn't.
We raised $125K AUD from friends, family, and personal savings. Our one direct hire was a data scientist who handled AI model training and automation. Beyond the five of us, we had six others — user researchers, a backend engineer, consultants and advisors — who stayed because they believed in what we were building. Most worked without pay.
When you're spending your own money and your friends' money, you develop a different relationship with every dollar. That hyper-fixation on cost shaped everything I've built since.
What We Built
Working with our data scientist, I architected an ML system that combined multiple approaches. The key insight was using models together rather than in isolation — each algorithm validated and enriched the others' findings.
- Topic Modelling to identify patterns in customer conversations and support tickets
- ARIMA models for time-series forecasting of engagement and retention metrics
- Logistic Regression to predict conversion likelihood based on multi-variable inputs
- Sentiment Analysis to quantify emotional responses from qualitative feedback
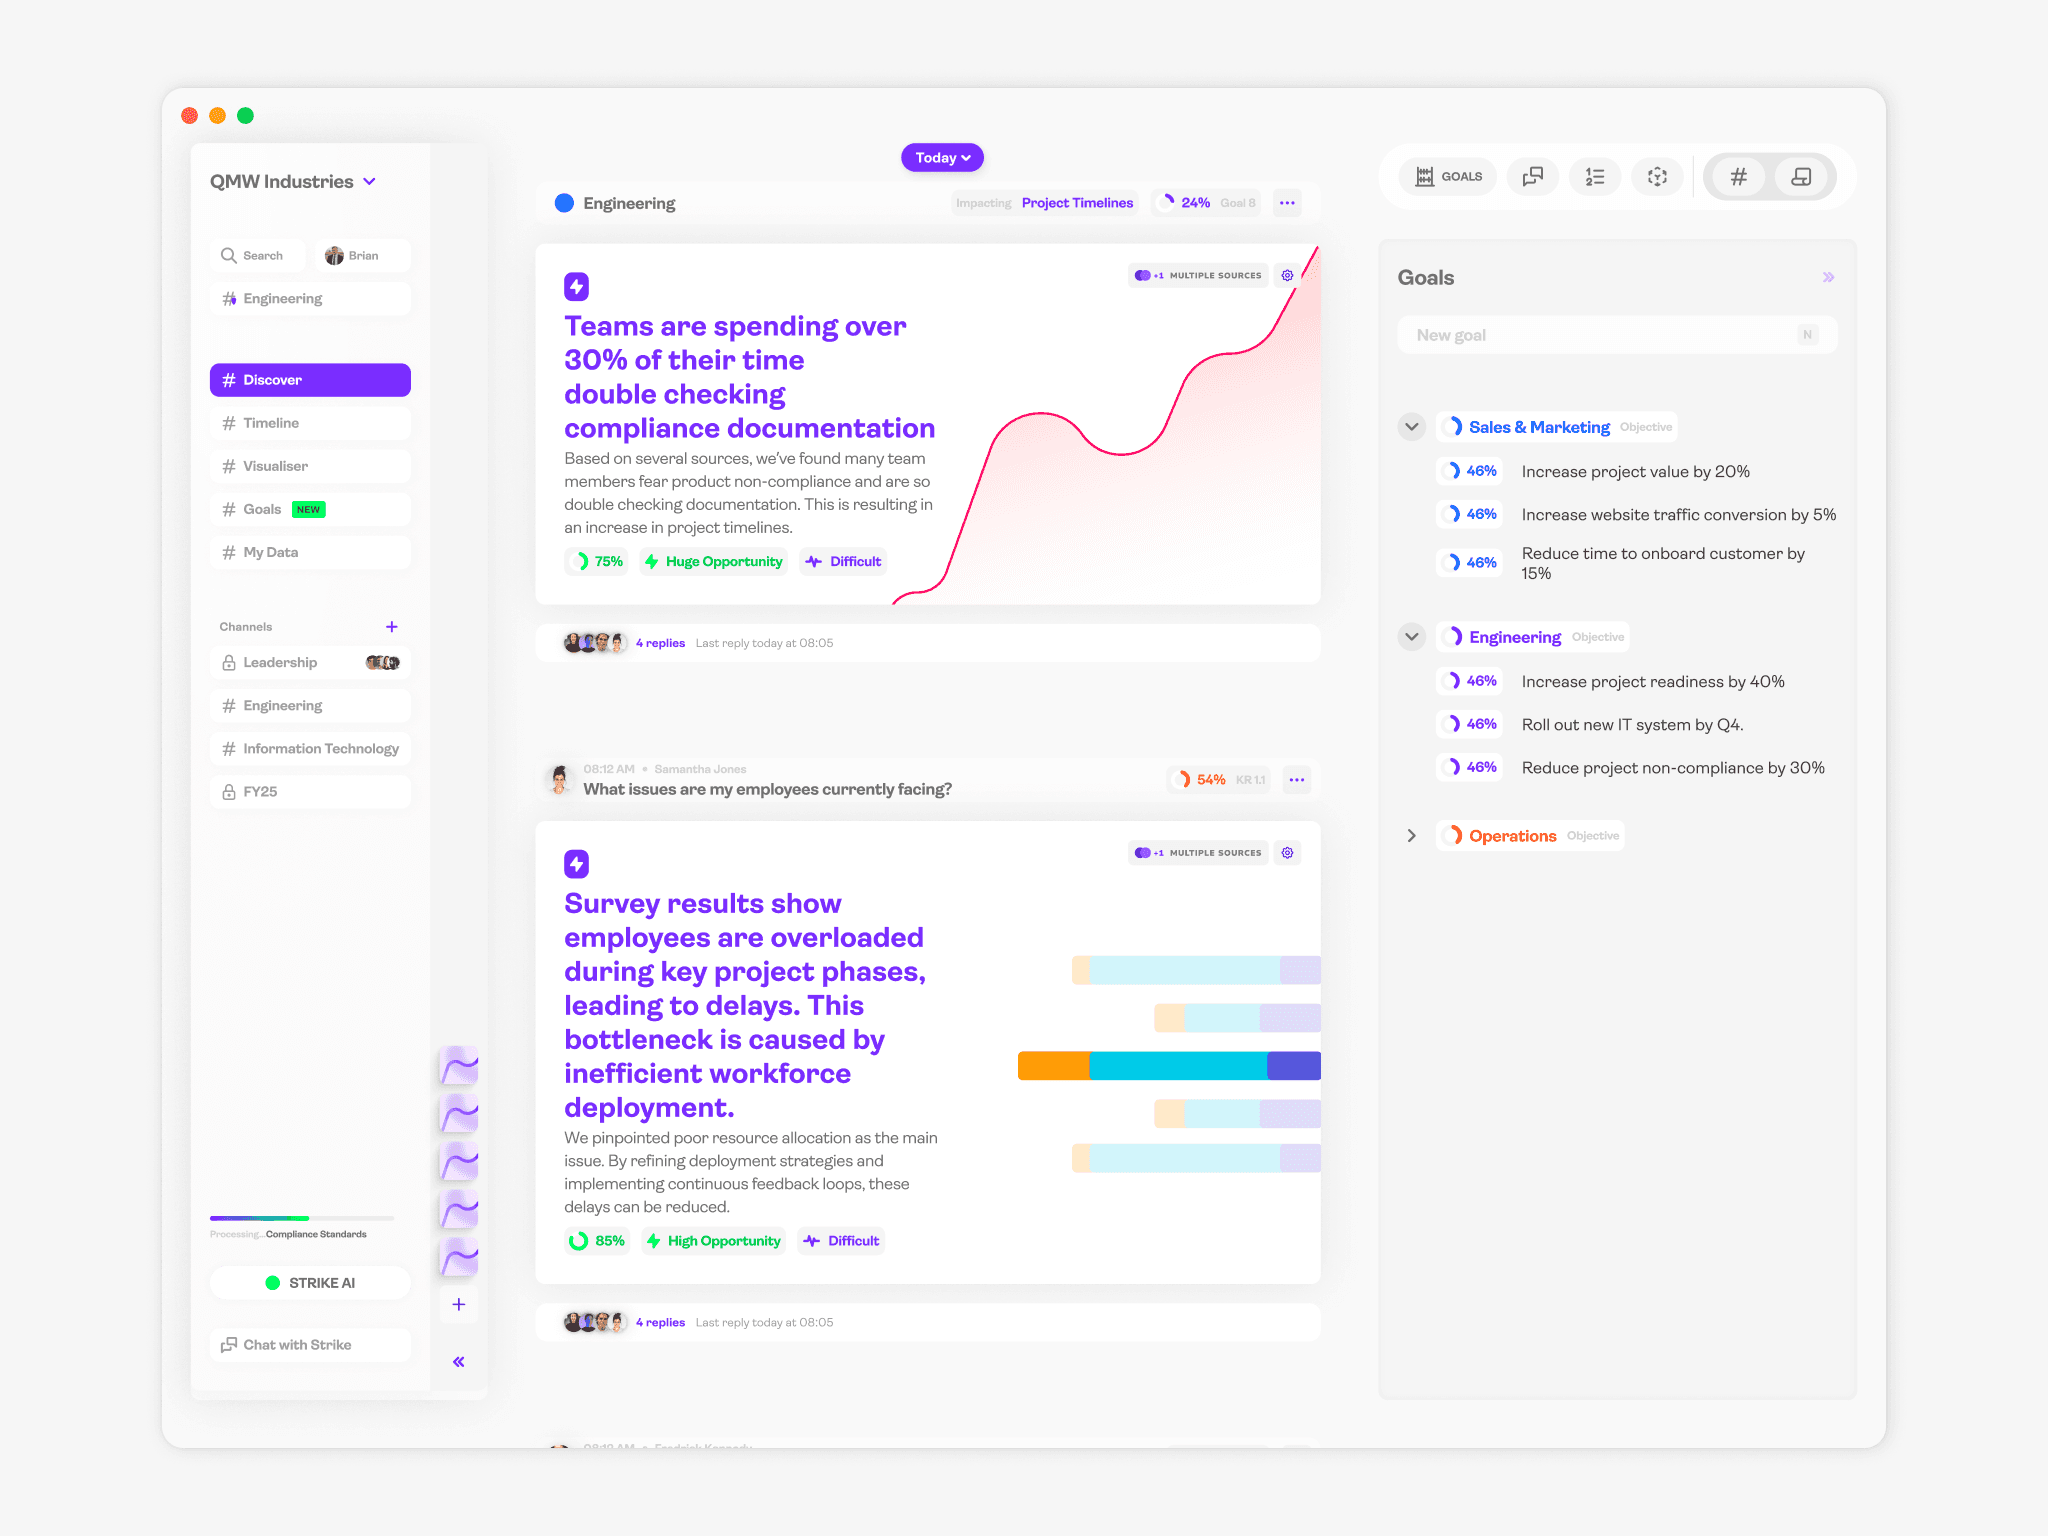
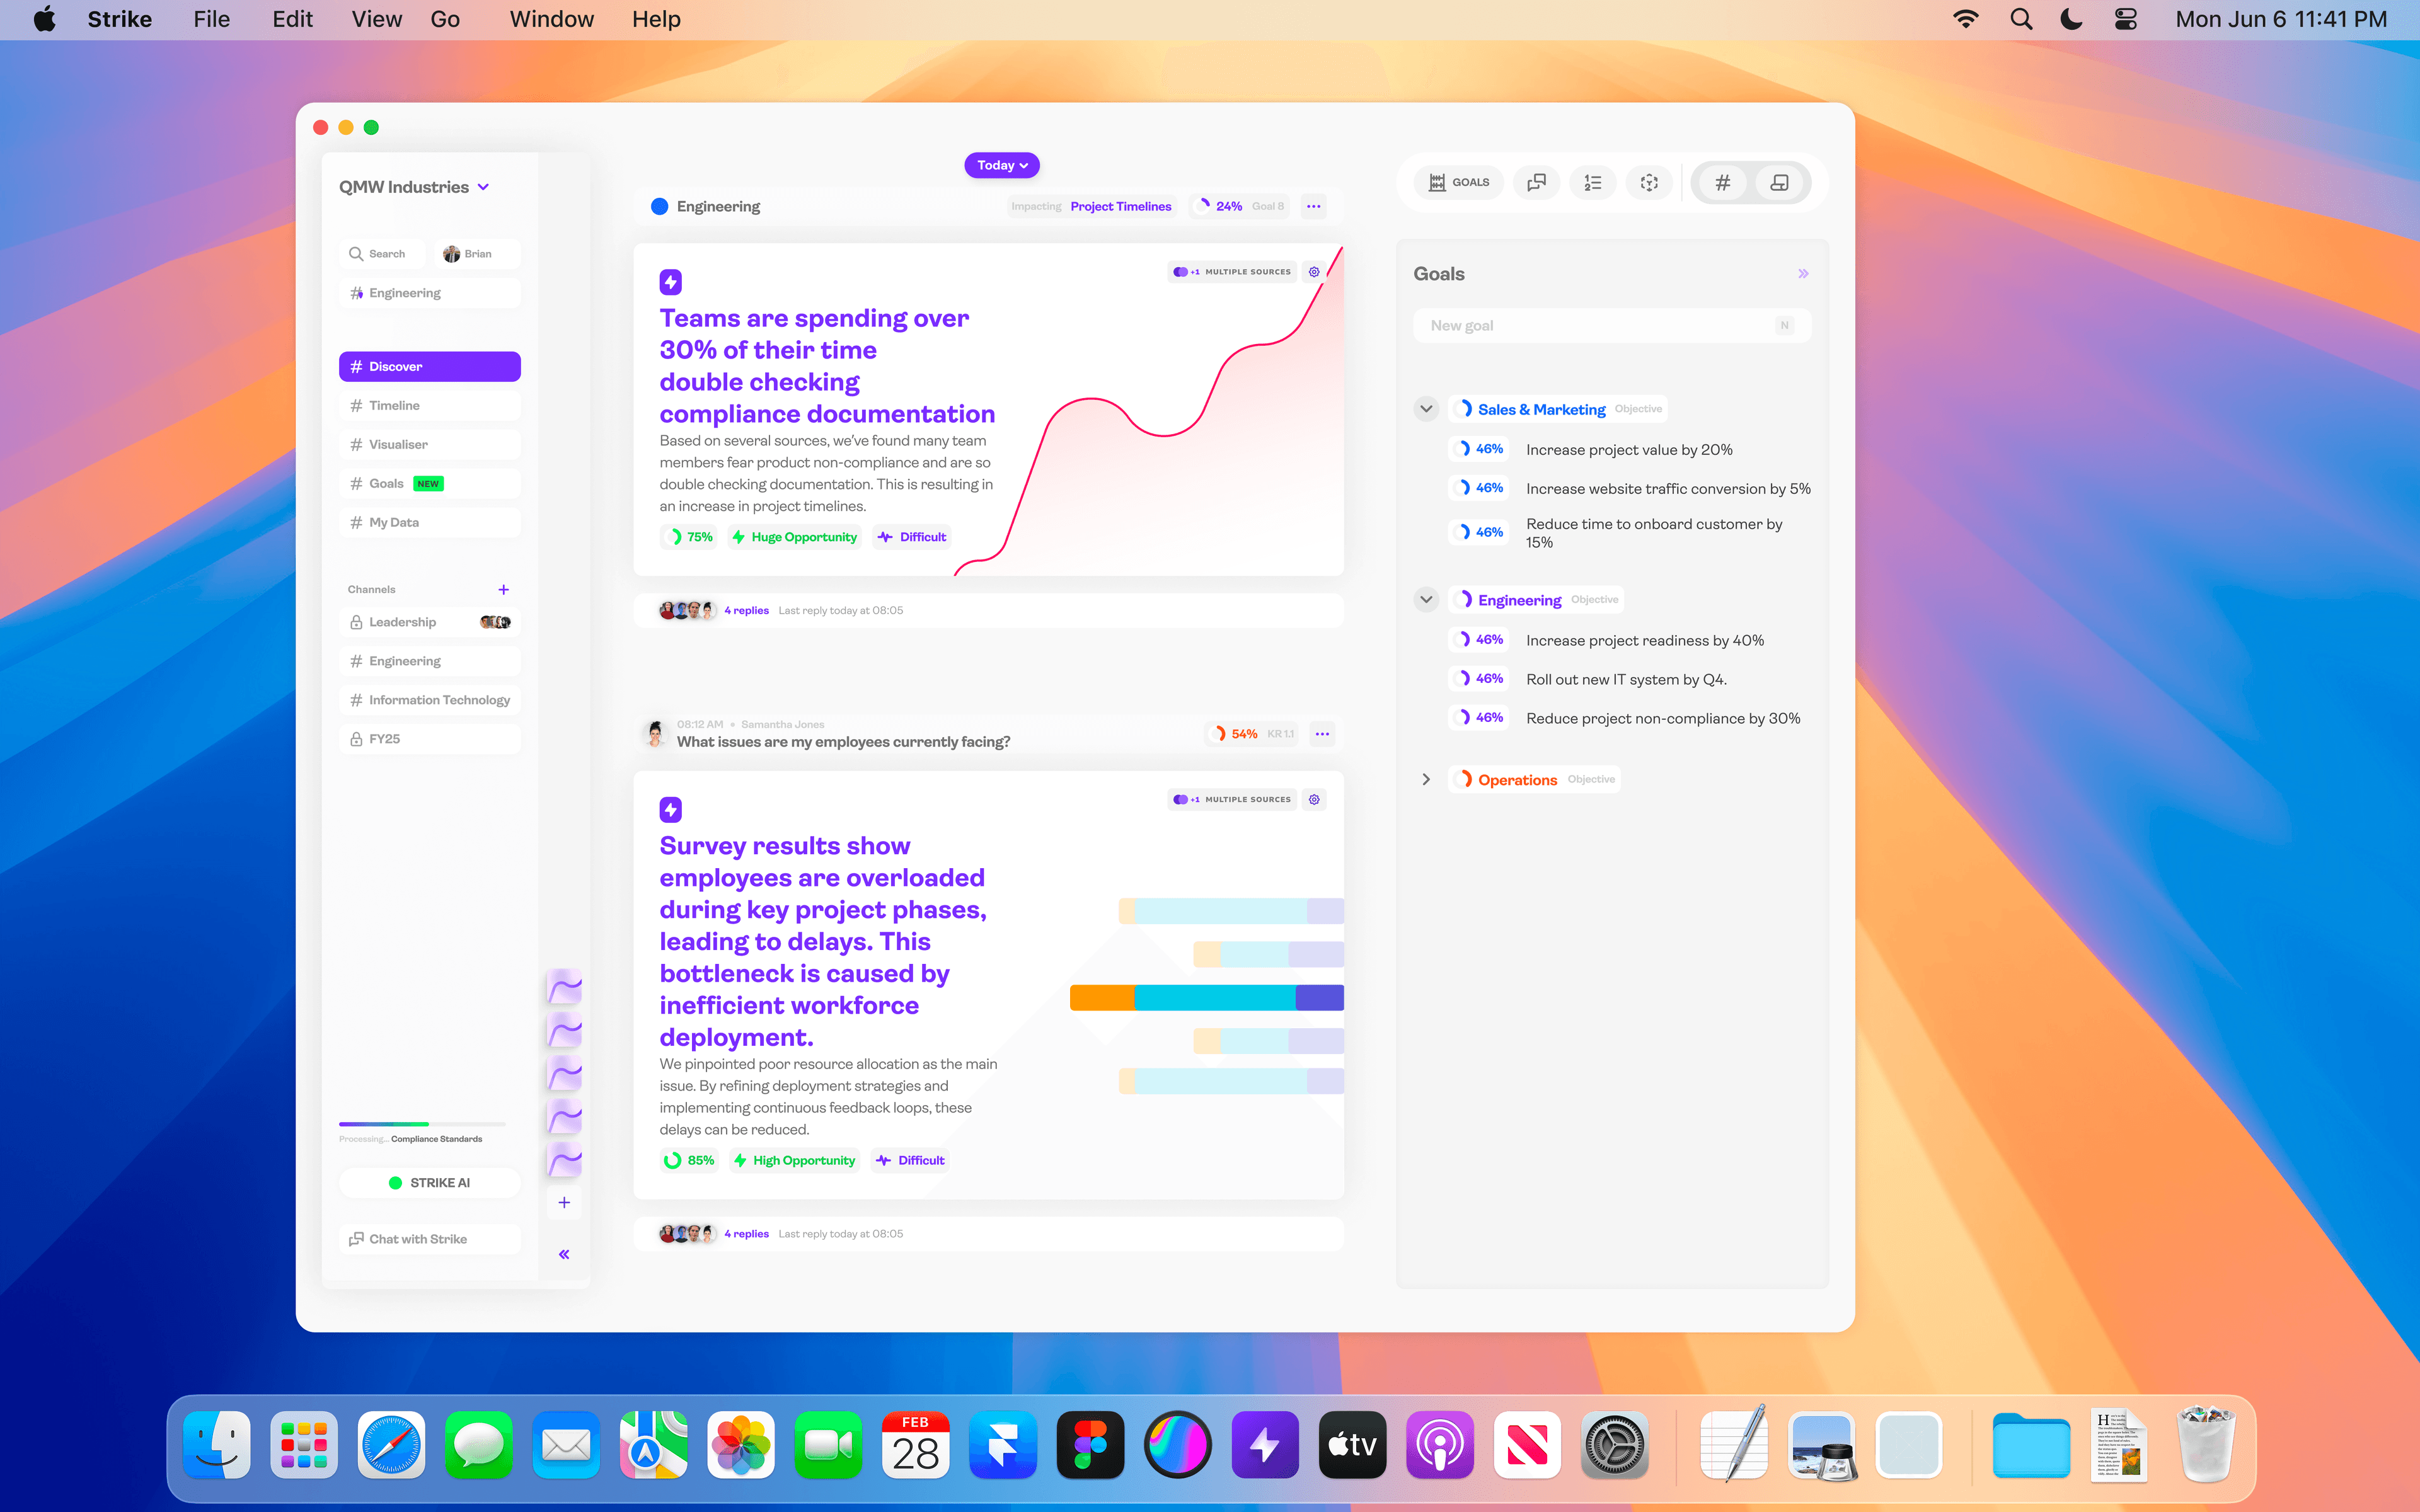
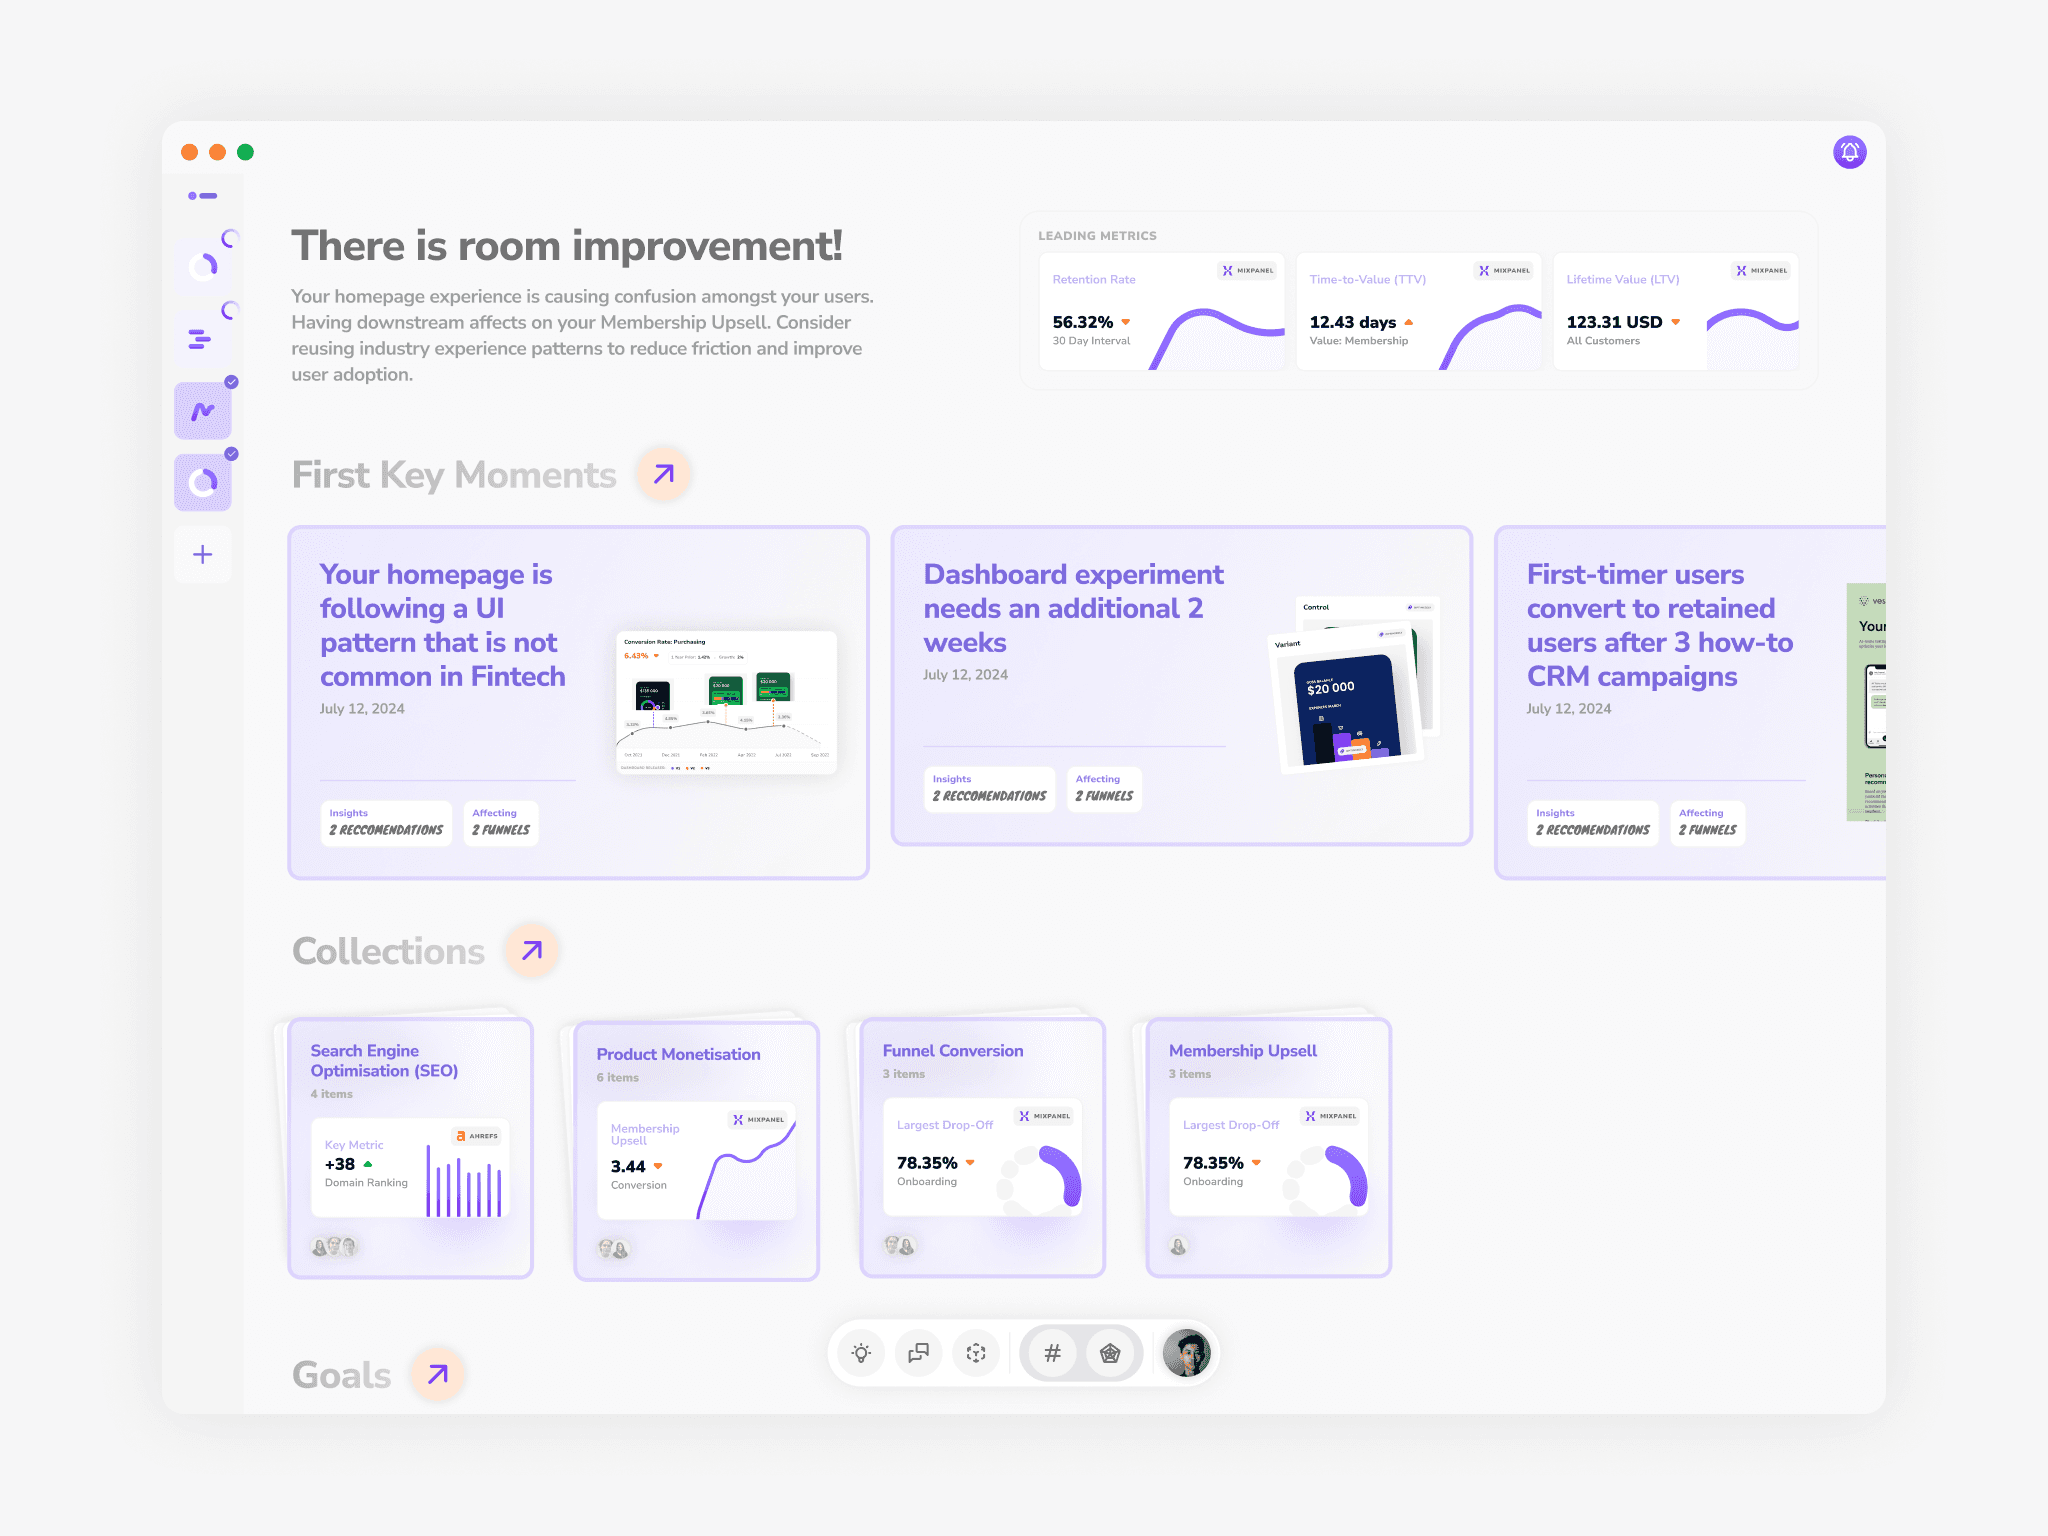
Every algorithmic decision had to be explainable. We couldn't just tell users what to do — we had to show them why our AI reached those conclusions. I designed a progressive disclosure interface that surfaced key insights immediately while allowing users to drill into the reasoning behind each recommendation.
In our pilot programme, we surveyed and observed how teams actually generated insights. The process was staggering: roughly two hours reviewing existing data sets, two hours reviewing customer insights, time scheduling and conducting interviews, then two hours of post-interview synthesis — repeated across multiple participants. The total cycle for a single round of qualitative insight generation ran well over fifteen hours. Our platform compressed this significantly, but the honest truth is we never had enough paying users to validate the compression at scale.
13 Pivots
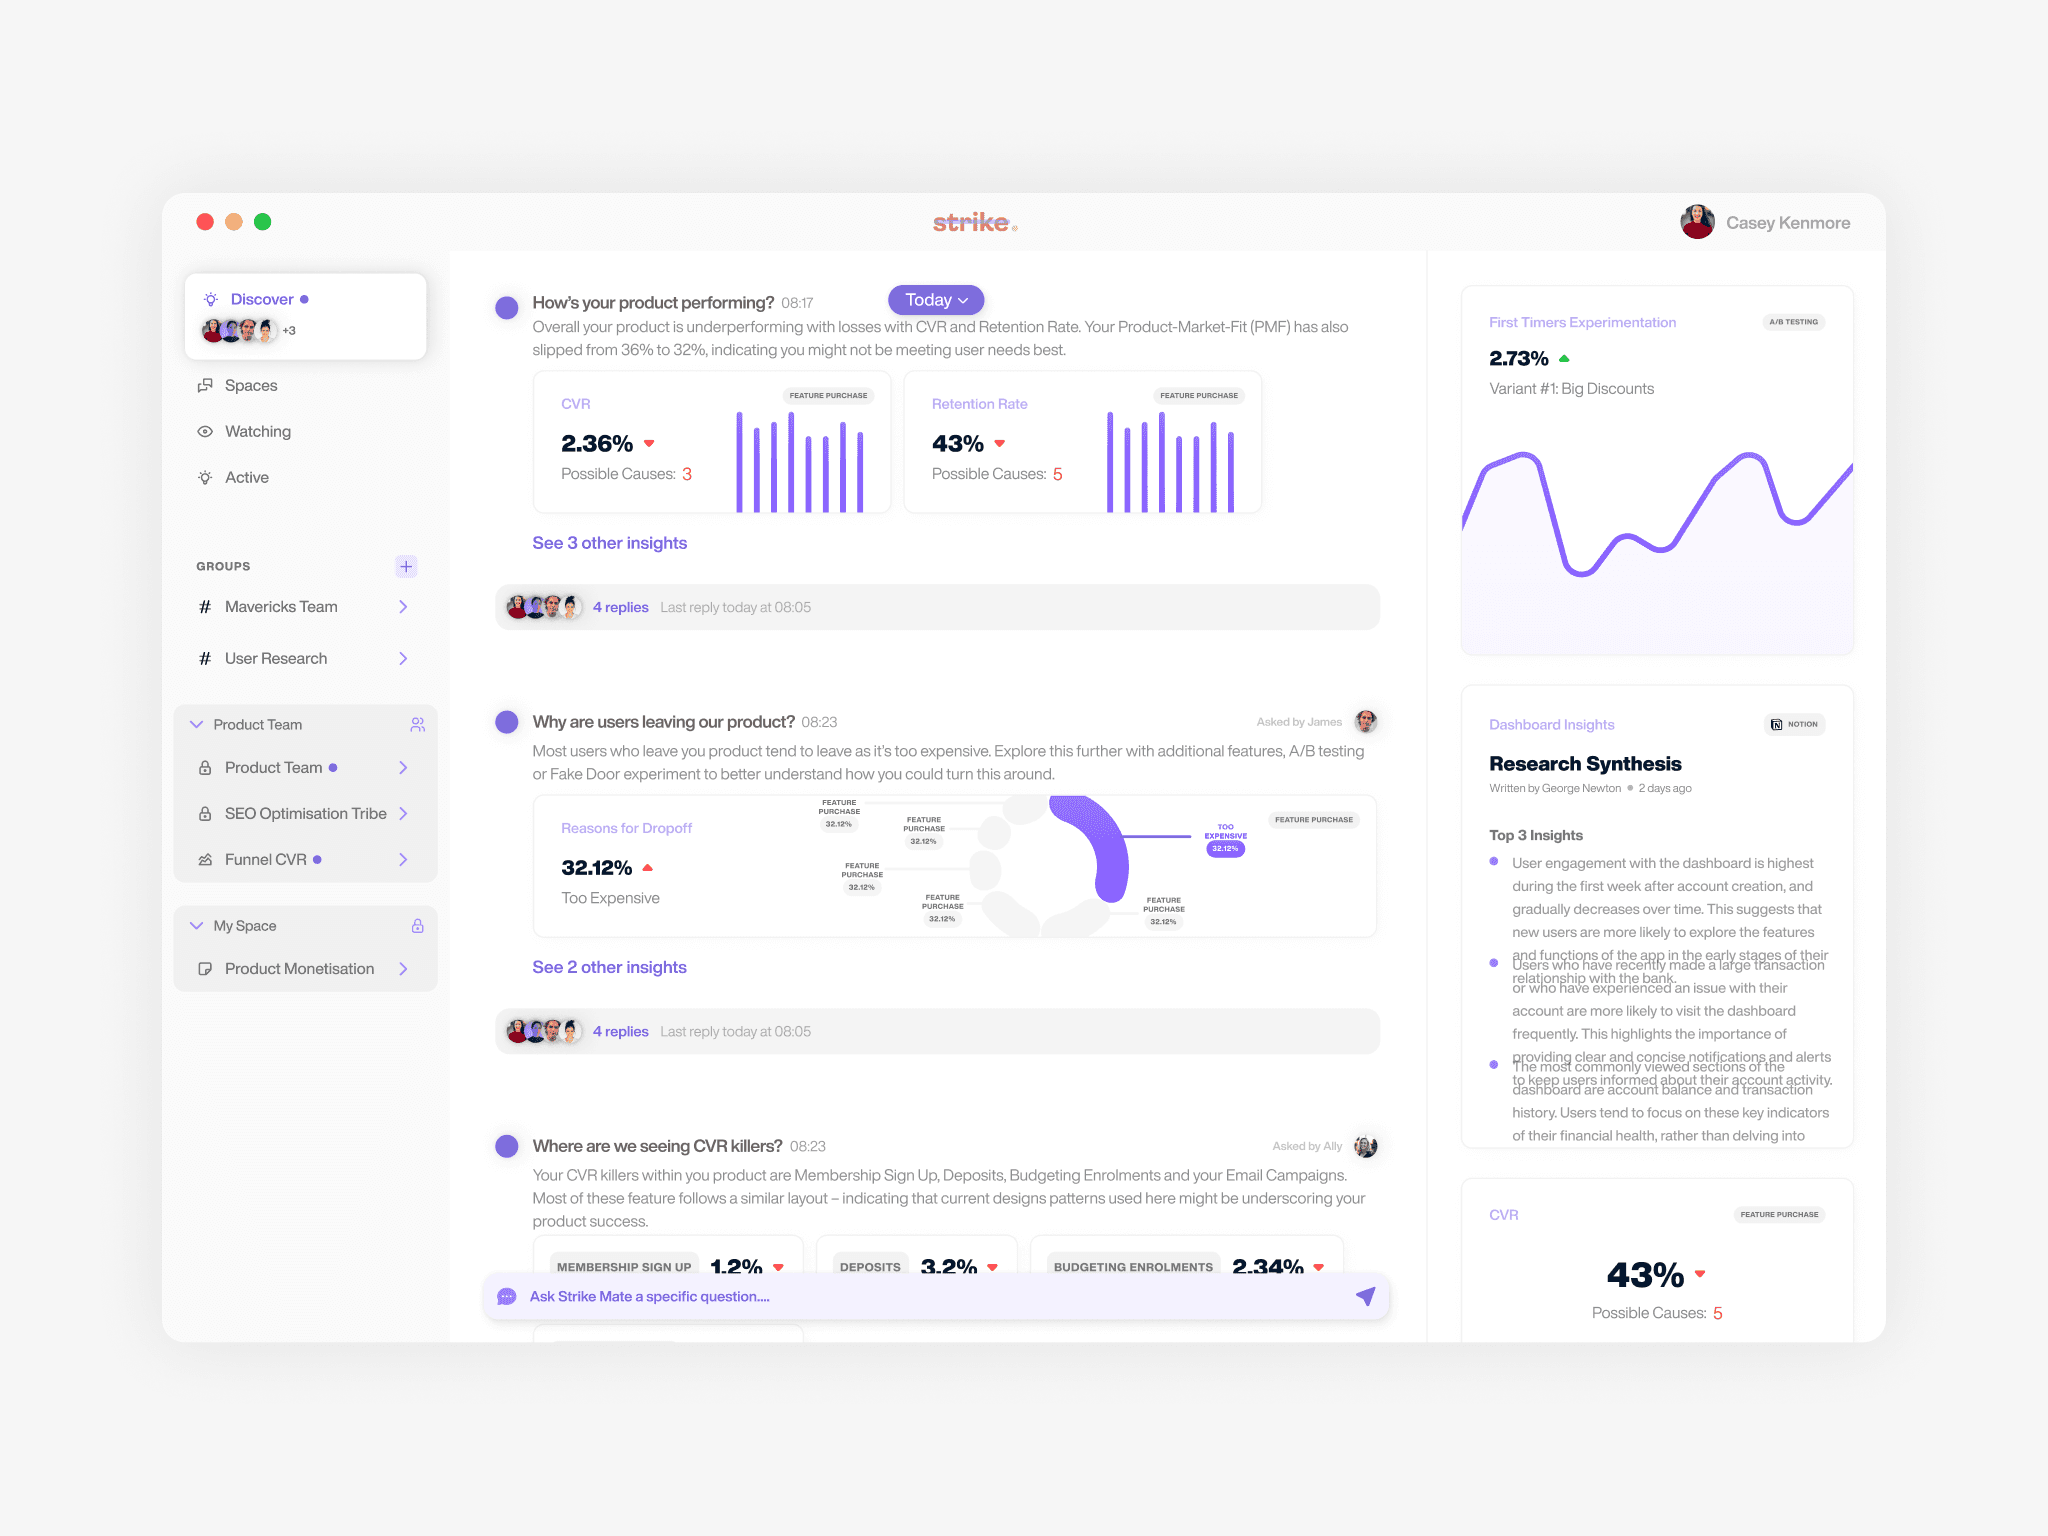
We instrumented everything to understand how teams actually used our insights. The data revealed something we didn't want to hear: people would look at our analysis, say 'that's interesting,' then do nothing. The gap between insight and action was where every analytics tool failed, including ours.
People would look at our analysis, say 'that's interesting,' then do nothing. That gap killed us.
What followed was 13 iterative pivots over 14 months. We pivoted fast — sometimes weekly — driven by customer research and the AI landscape changing underneath us at the same time. One week's technical assumptions were obsolete by the next. Each pivot tried to be bolder than the last.
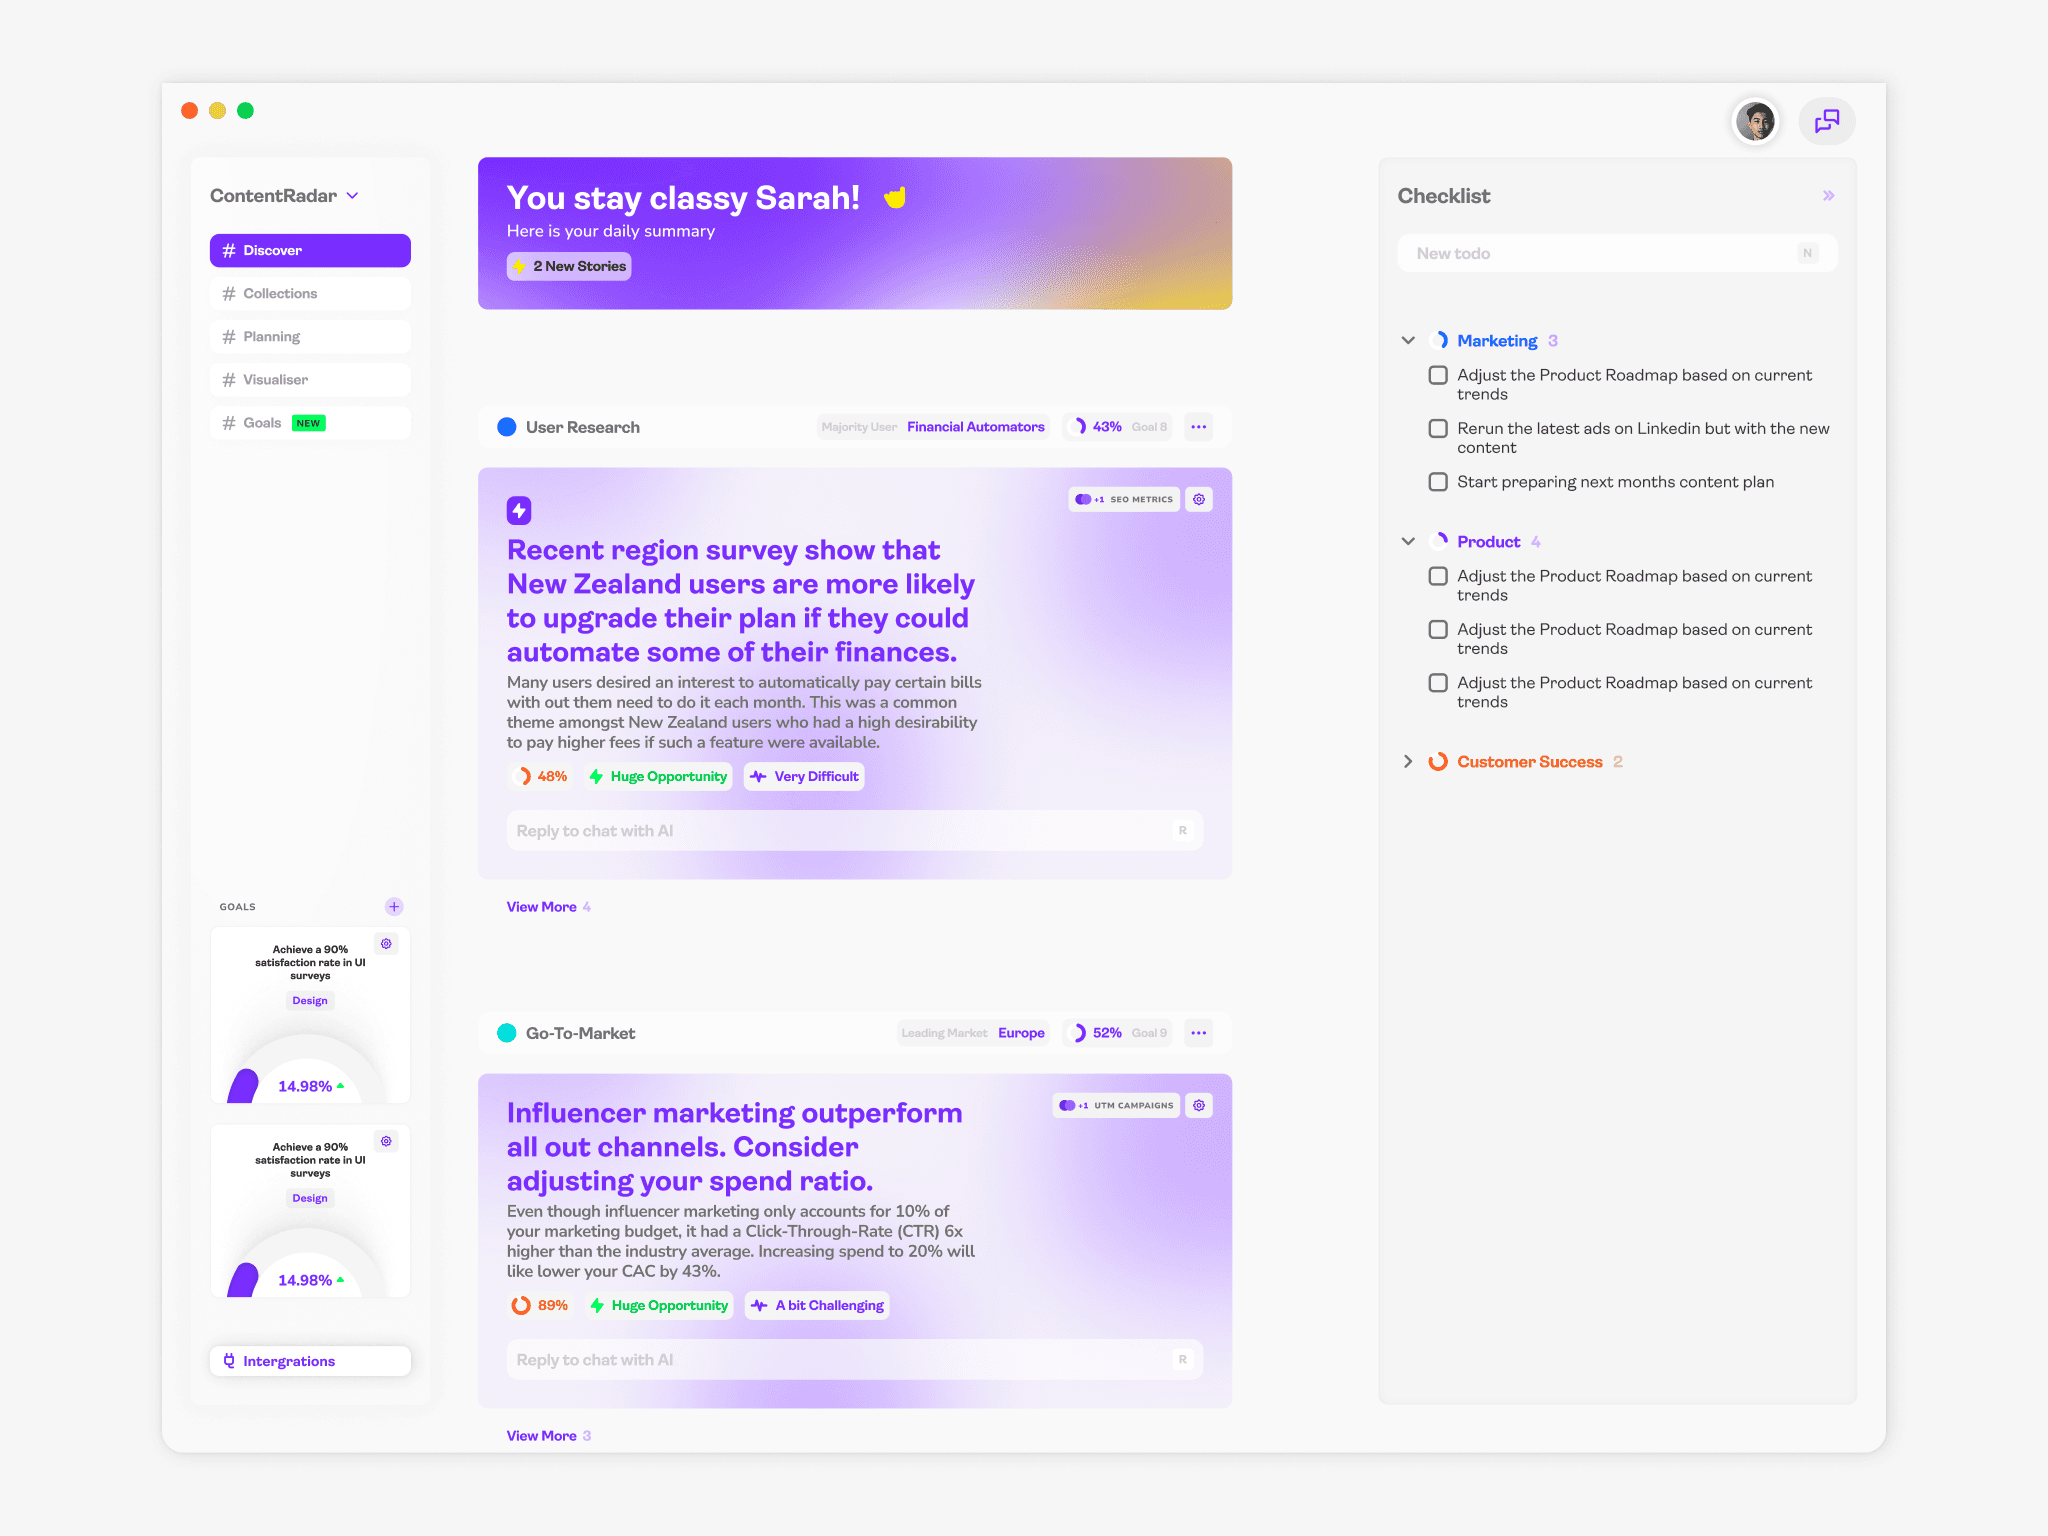
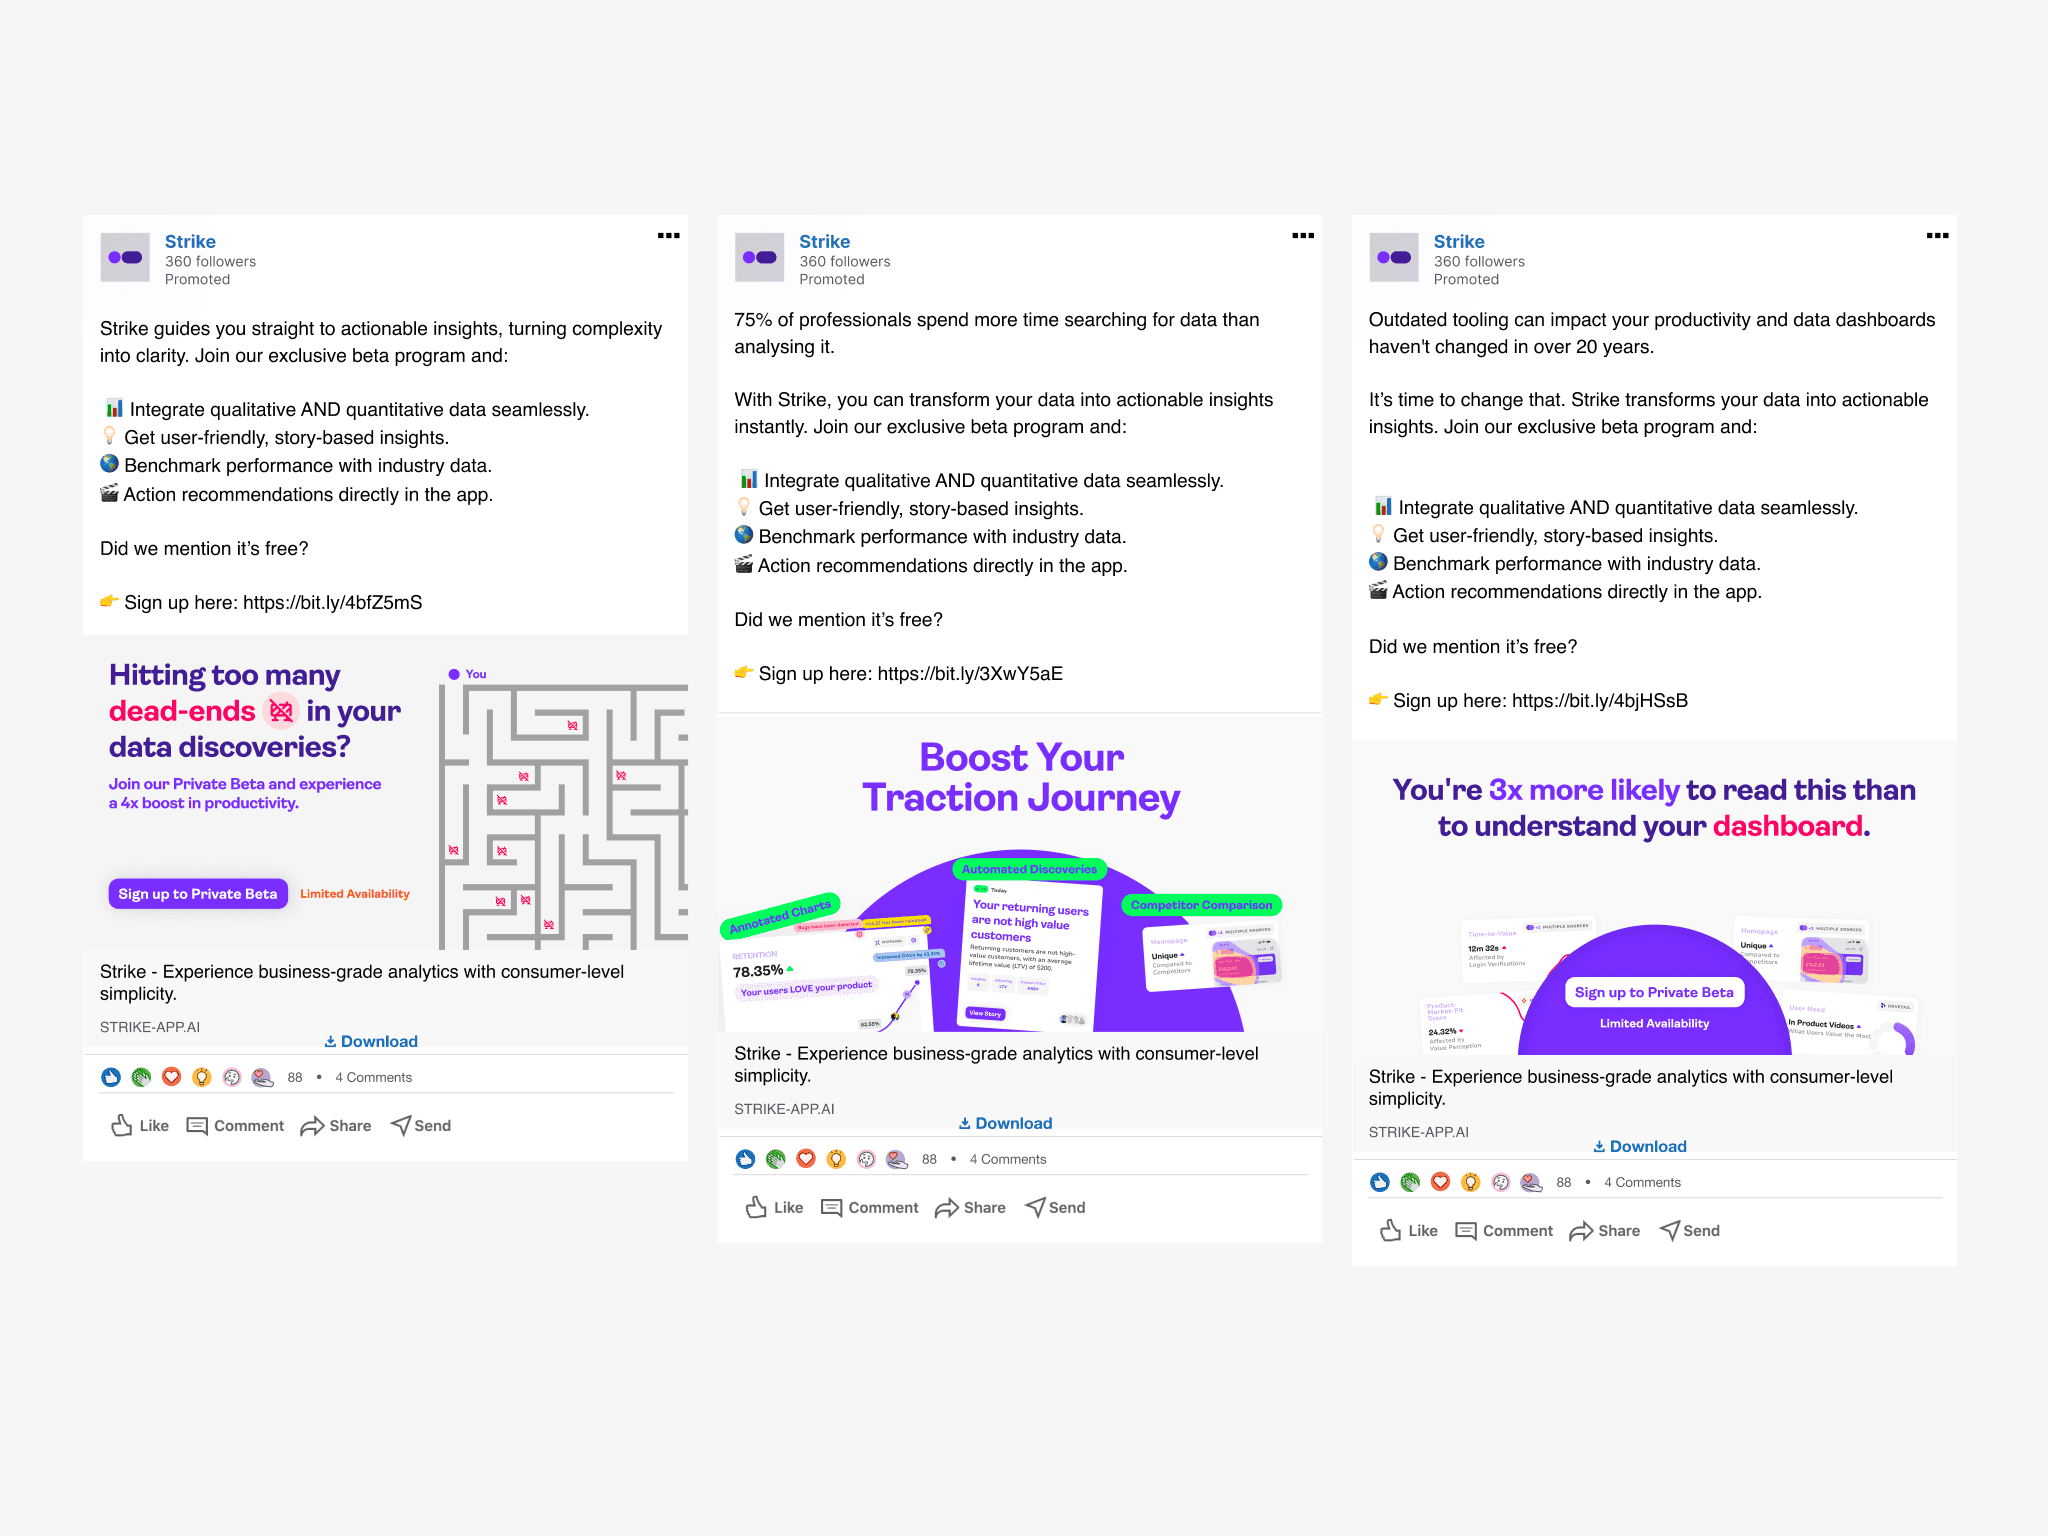
- Users stalled on blank chat screens with no idea what to ask. Pivoted to pre-defined insight stories aligned to each user's role
- Leaders didn't want to use a product themselves — they wanted insights brought to them. Shifted focus to the product managers and designers who actually work with data
- Marketing data surfaced the most actionable insights. Expanded scope from product teams to cross-functional marketing teams
- Customers without product functions relied on full-service agencies. Agencies were terrified AI would replace them. Pivoted to serve agencies directly
- Agencies used 10+ different tools and resisted consolidation. Narrowed focus to eCommerce businesses with small teams managing their own data
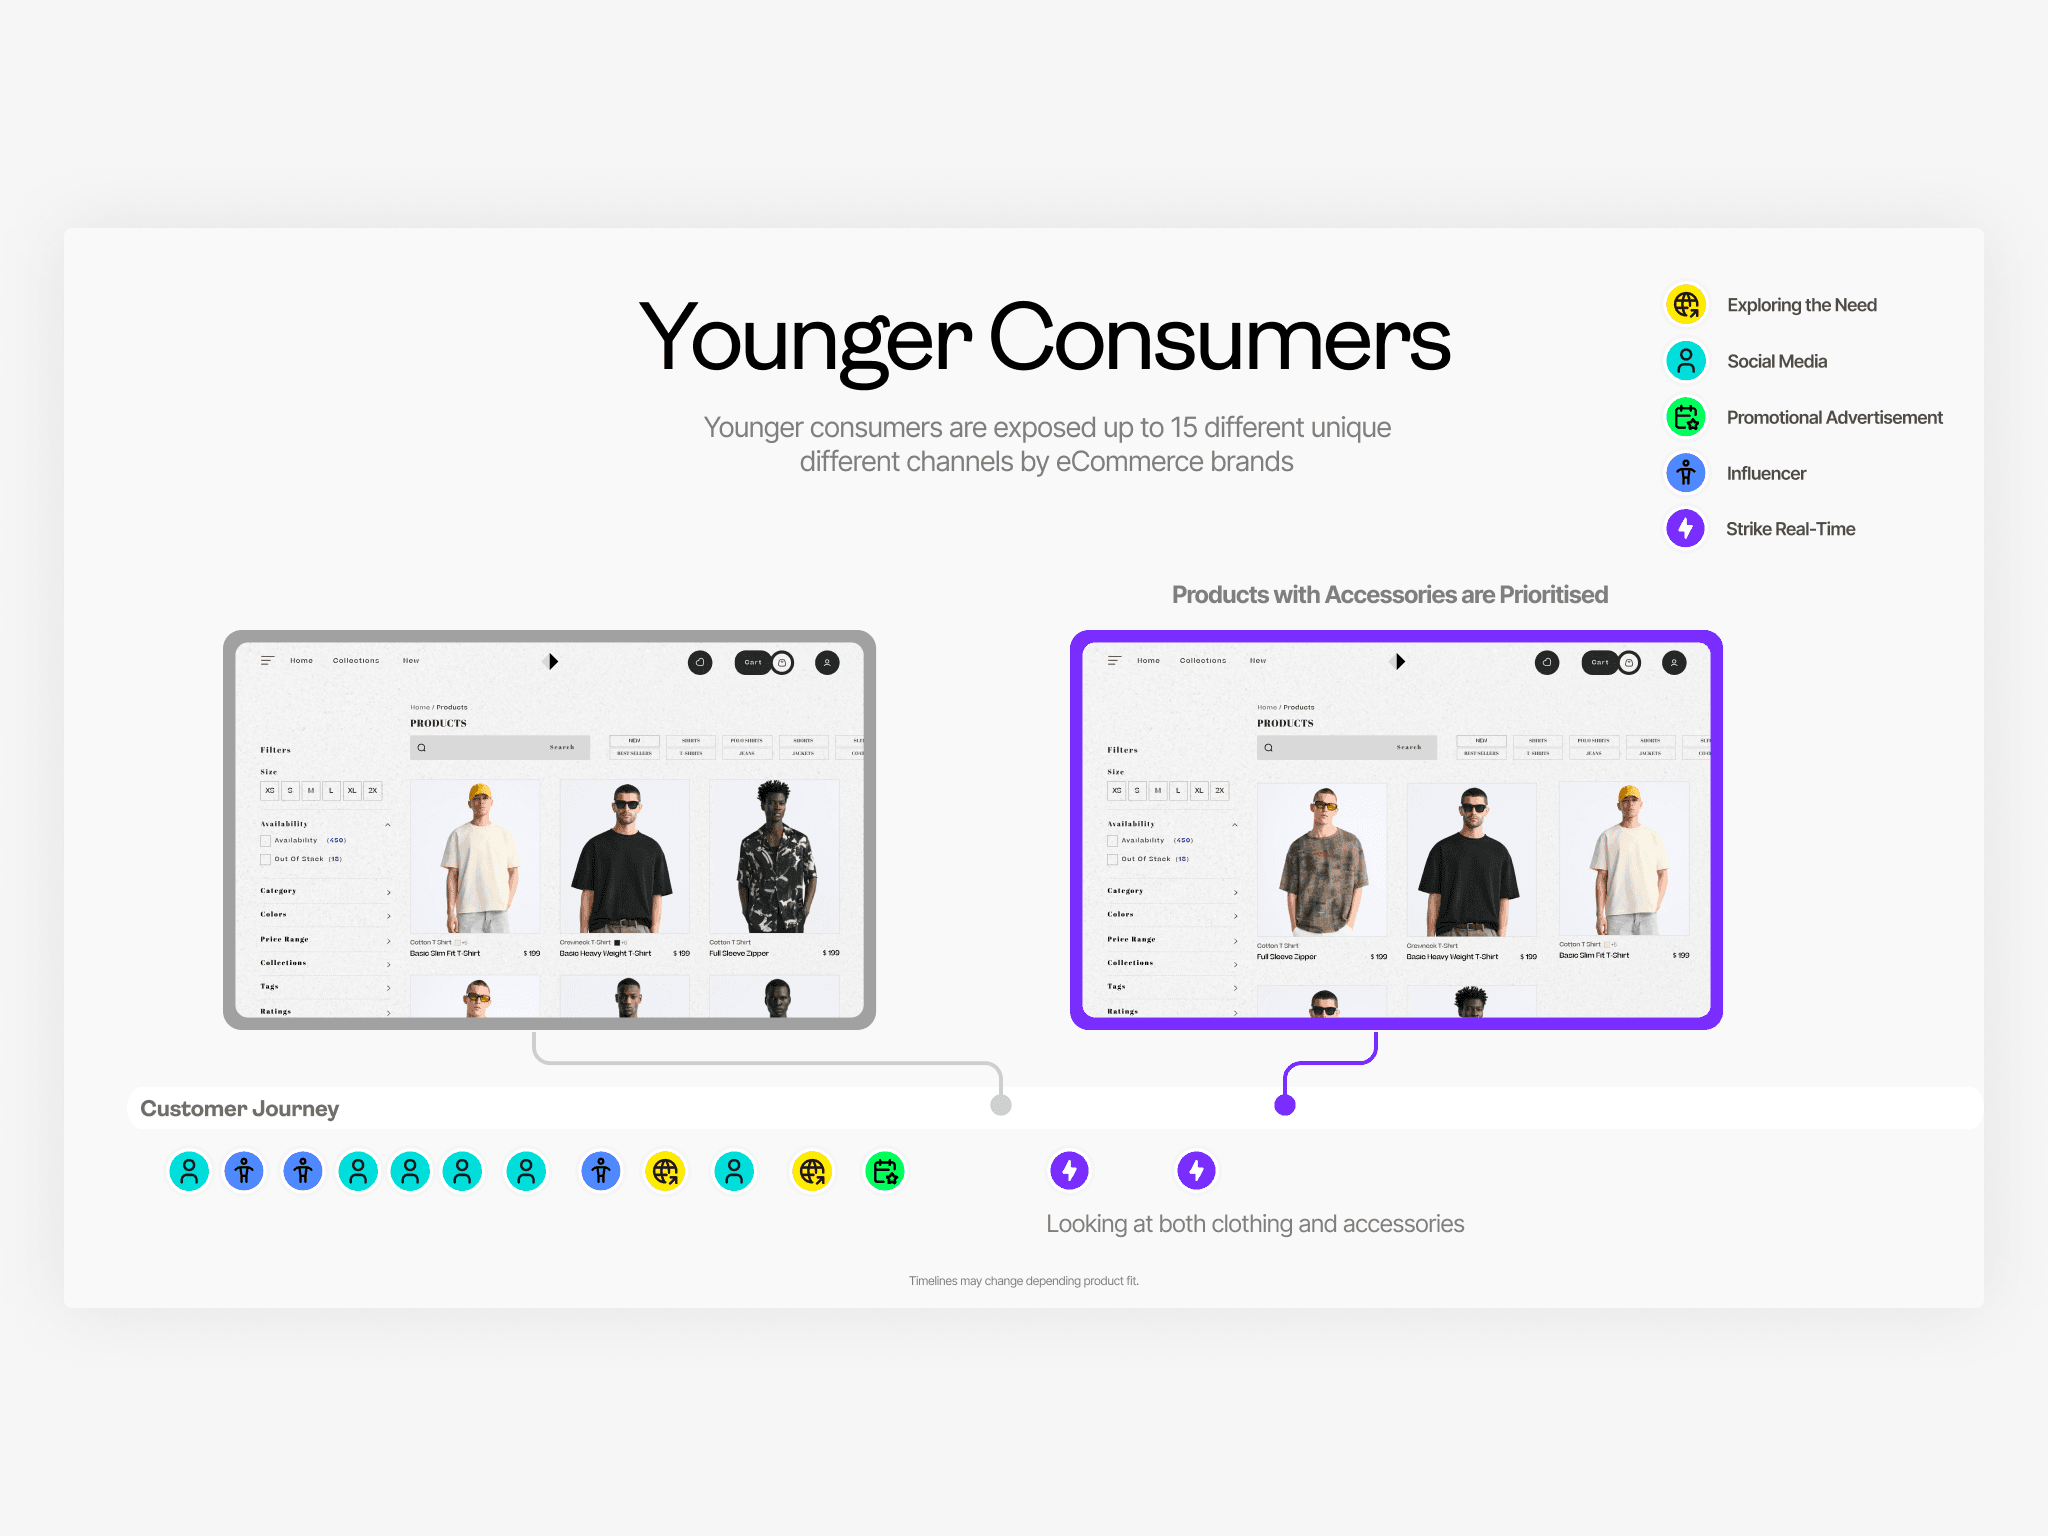
- Compared eCommerce operators with digital product expertise (like Chewy) against those without — the skill gap in conversion was enormous. The people who needed help most couldn't articulate what help they needed
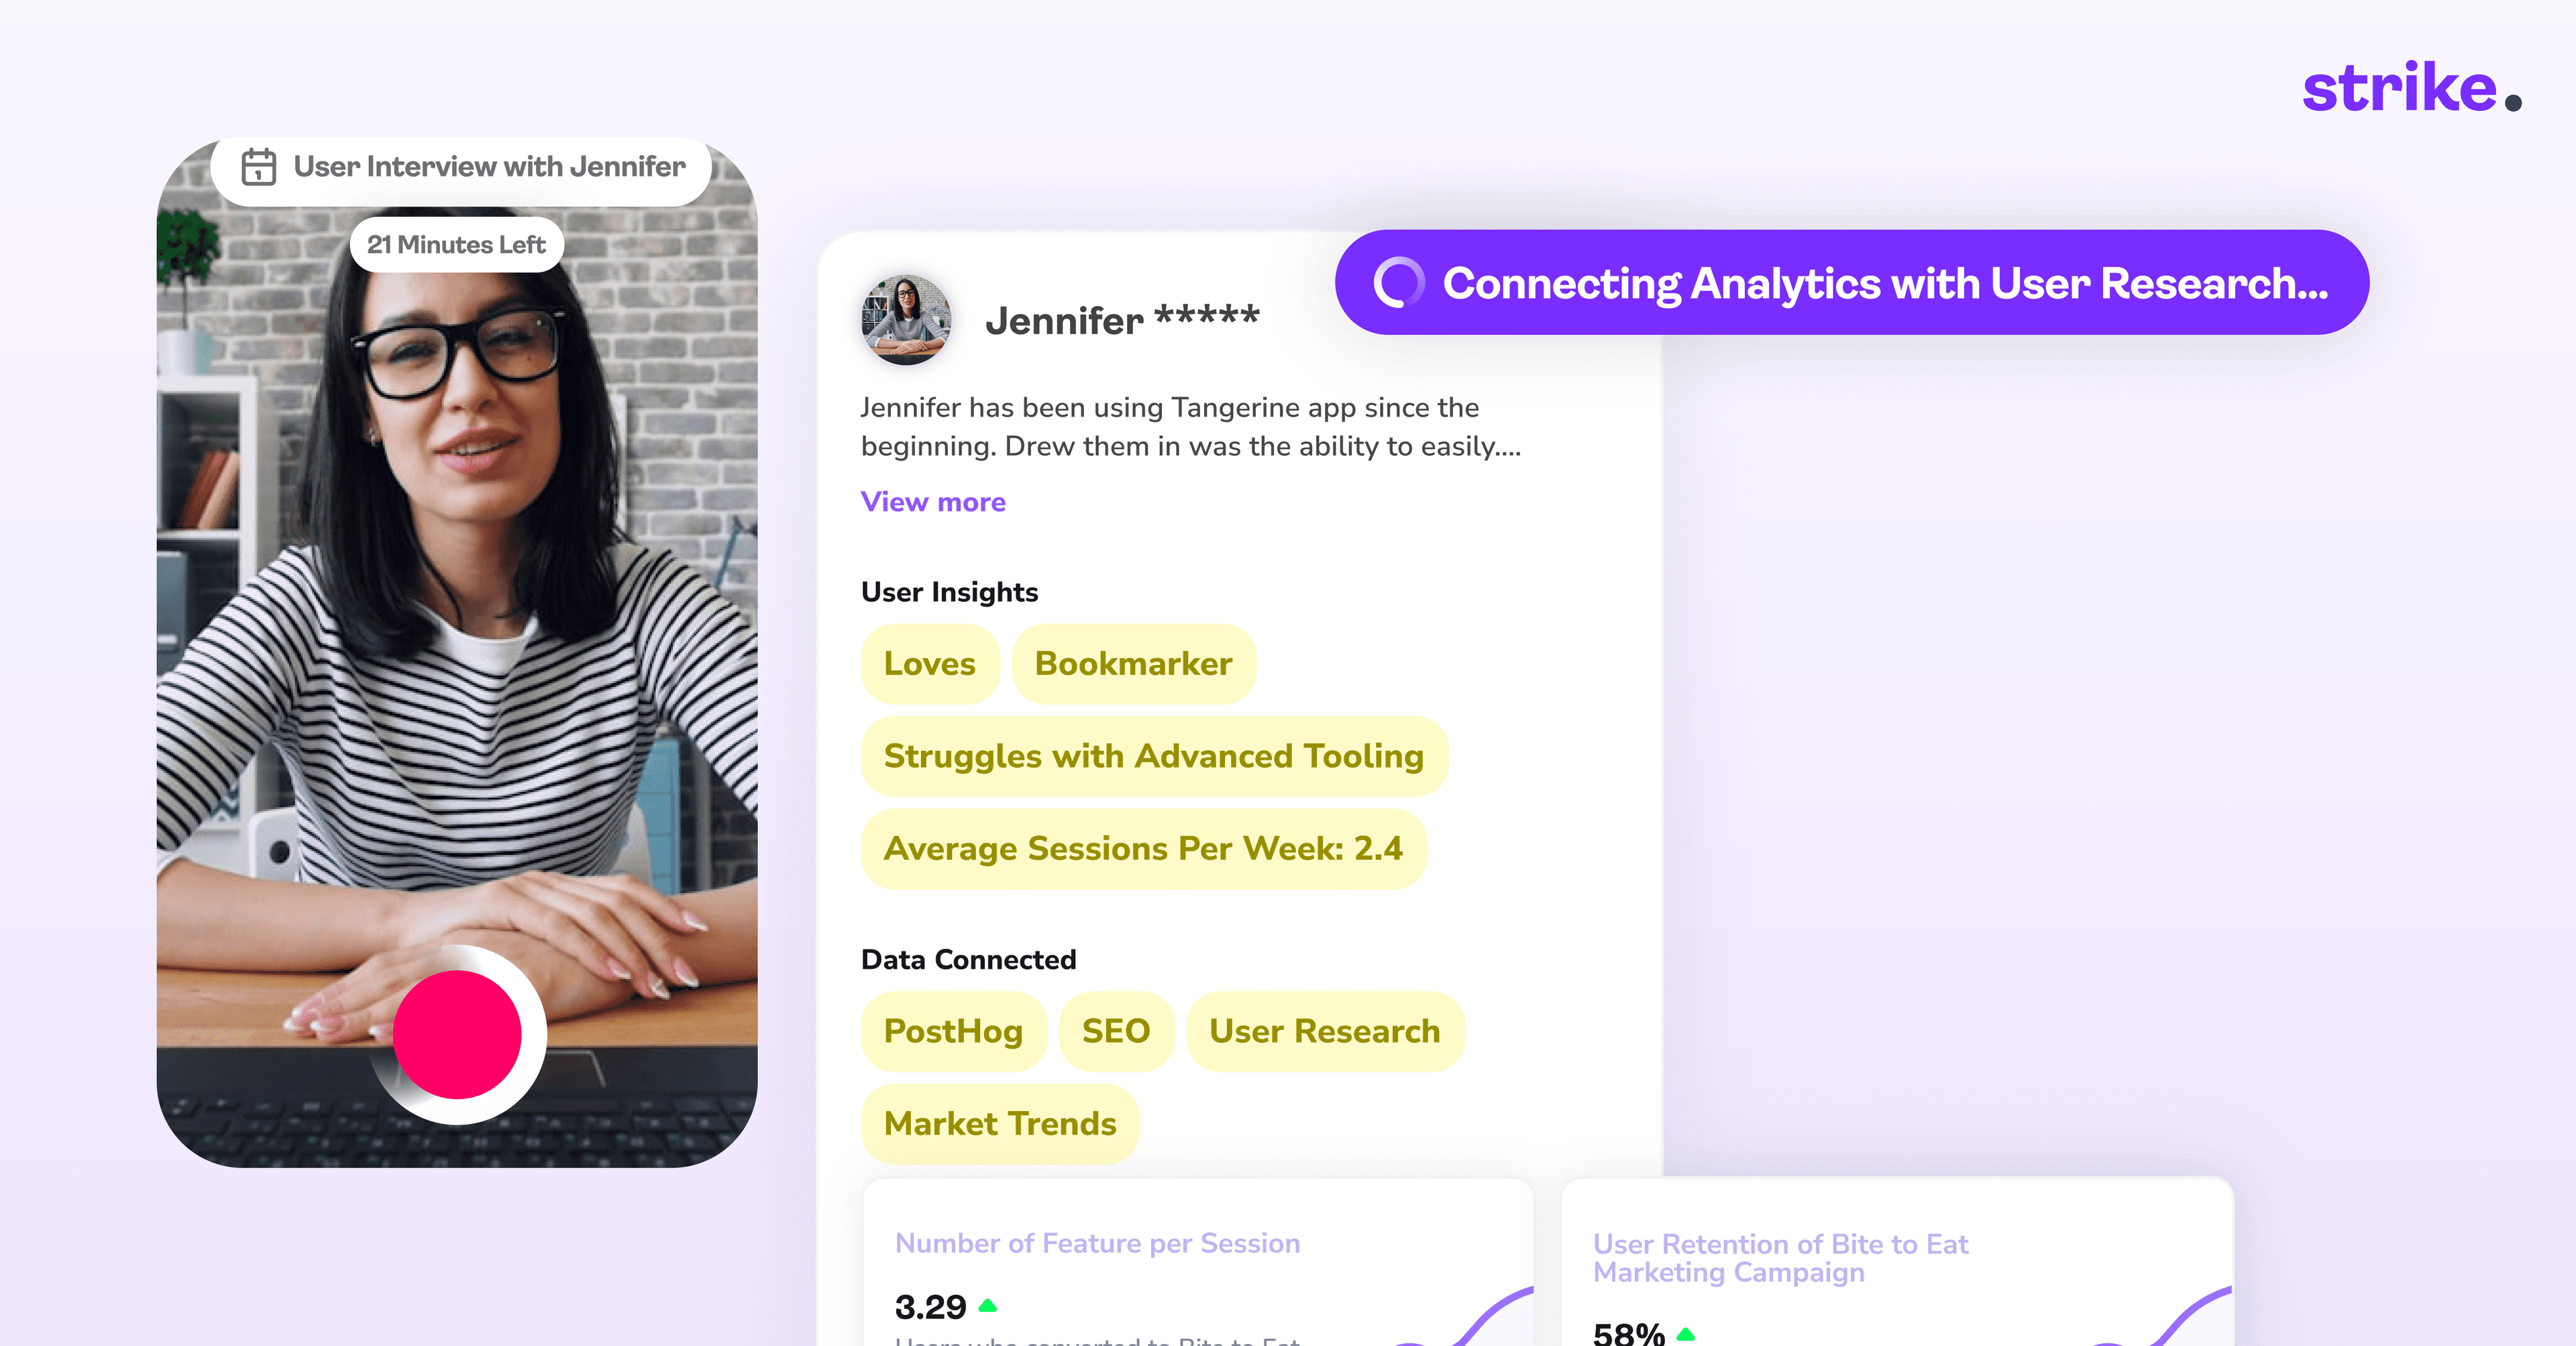
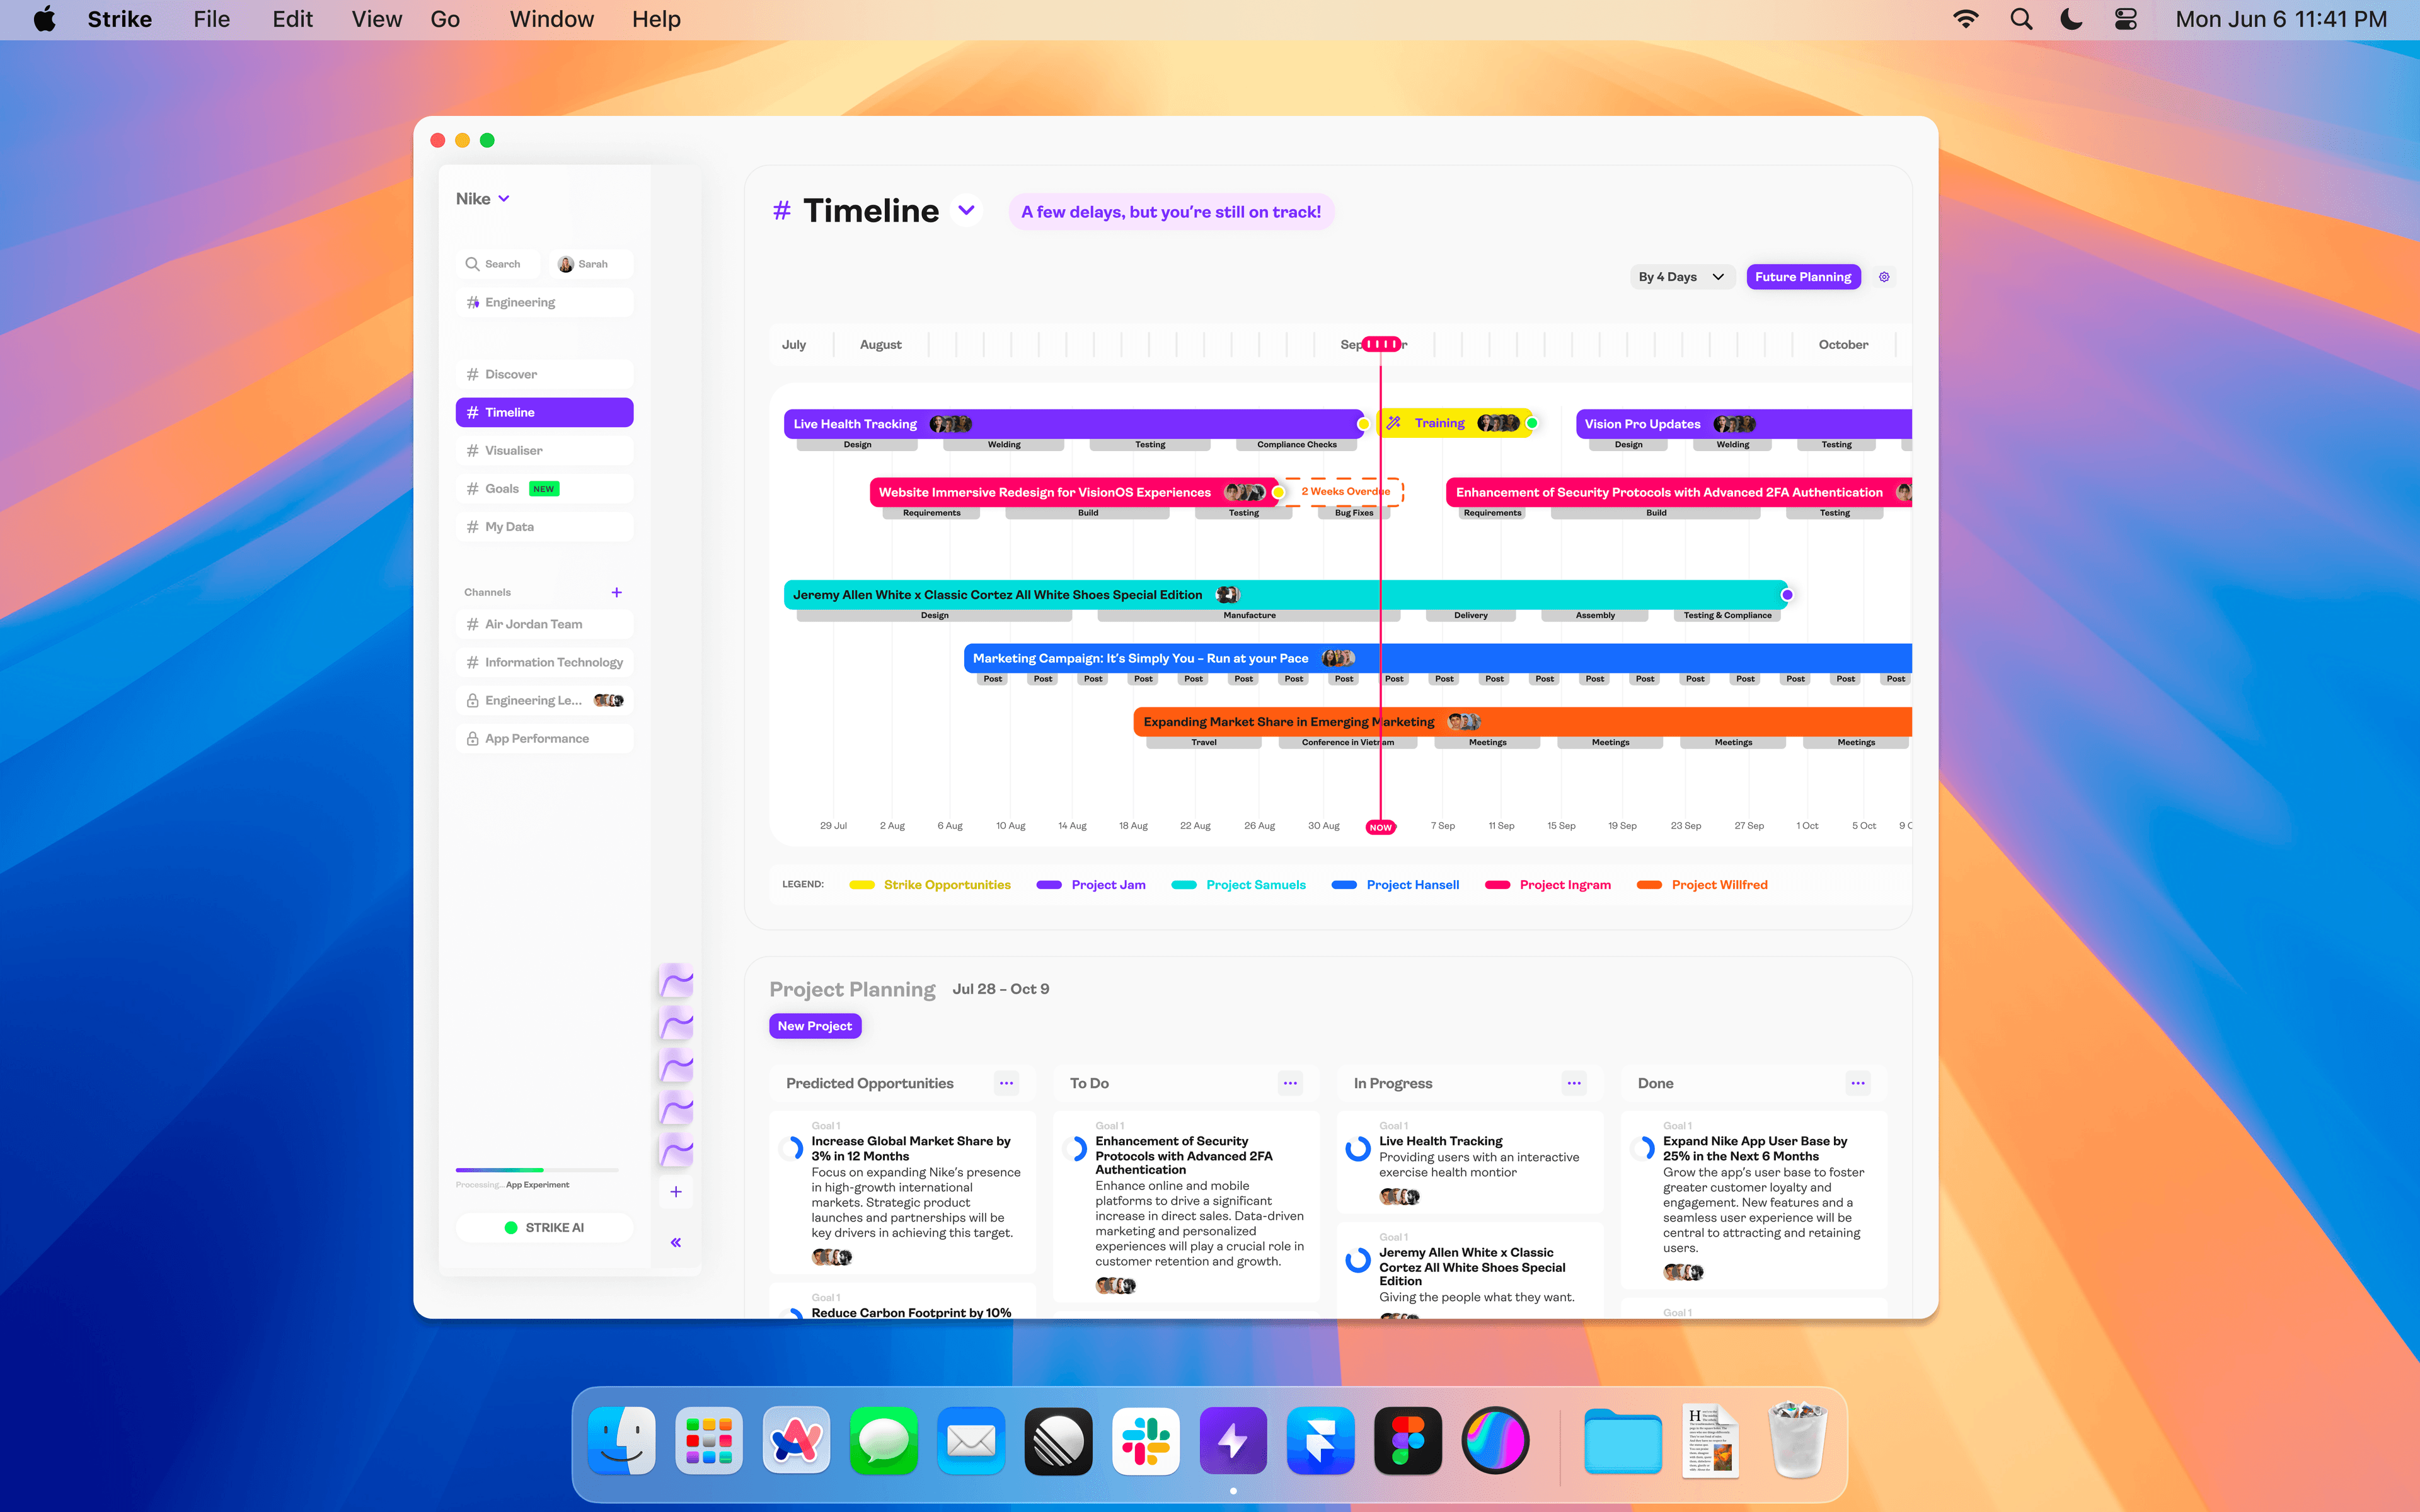
- Pivoted from analytics to automation: real-time, per-session website optimisation using a components library connected to customer mindsets and psychology, running continuous live A/B tests that learn and refine automatically
The final direction was genuinely compelling. We had a working miniaturised prototype. US investors were interested — some turned us away only because they'd already invested in the space, which told us we were in the right territory. The core technical challenge was training the model to identify which component changes to make for specific customer mindsets. Changing the components themselves wasn't hard. Training the psychology layer was.
By the time we found the vision that excited investors, we had no money left to build it.
What Went Wrong
Several specific mistakes were detrimental. The biggest was hiring. We brought on too many non-technical, go-to-market people before the product was mature enough to sell. We had people focused on external outreach when there wasn't enough substance behind what they were pitching. With $125K, we should never have hired that many people on that tight a runway.
I hired a friend. I shouldn't have. I should have gone to market and found the right person for a specific role on a contracting basis with a fixed scope and fixed timeline. This is a mistake I've since developed a clear framework around: hire contractors first, measure the impact, then convert to permanent only when the workload is genuinely unmanageable through process or tooling changes.
We also received contradictory advice from investors. Australian VCs told us to sell more. US VCs told us to build more into the product. With no prior sales experience on the founding team, we couldn't effectively do either. We believed we had a strong product but couldn't find the penetration vector to have the right conversations with the right people. Maybe we were in the wrong location. Maybe we didn't raise enough upfront. Maybe we just didn't talk to enough customers early enough and didn't validate with prototypes before building.
We pitched 24 VCs from 1,289 targeted outreach emails and completed 4 accelerator programmes. Our LinkedIn campaigns achieved an 8.55% click-through rate — six times industry benchmarks — and a 1.86% beta sign-up conversion rate. We had 40+ beta sign-ups across eCommerce, agencies, and SaaS. But none of them paid. Interest was never the problem. Conversion to revenue was.
The End
We ran out of money. We stretched $125K from a projected 6 months to 14 months at a $7K monthly burn rate. All four founders and our data scientist stayed until the very end, earning no income for several months, trying to find the outcome we were looking for. Eventually we just had a conversation and closed down.
Five people stayed for months with no income because they believed in the problem. That kind of commitment deserved a better outcome than the one I delivered.
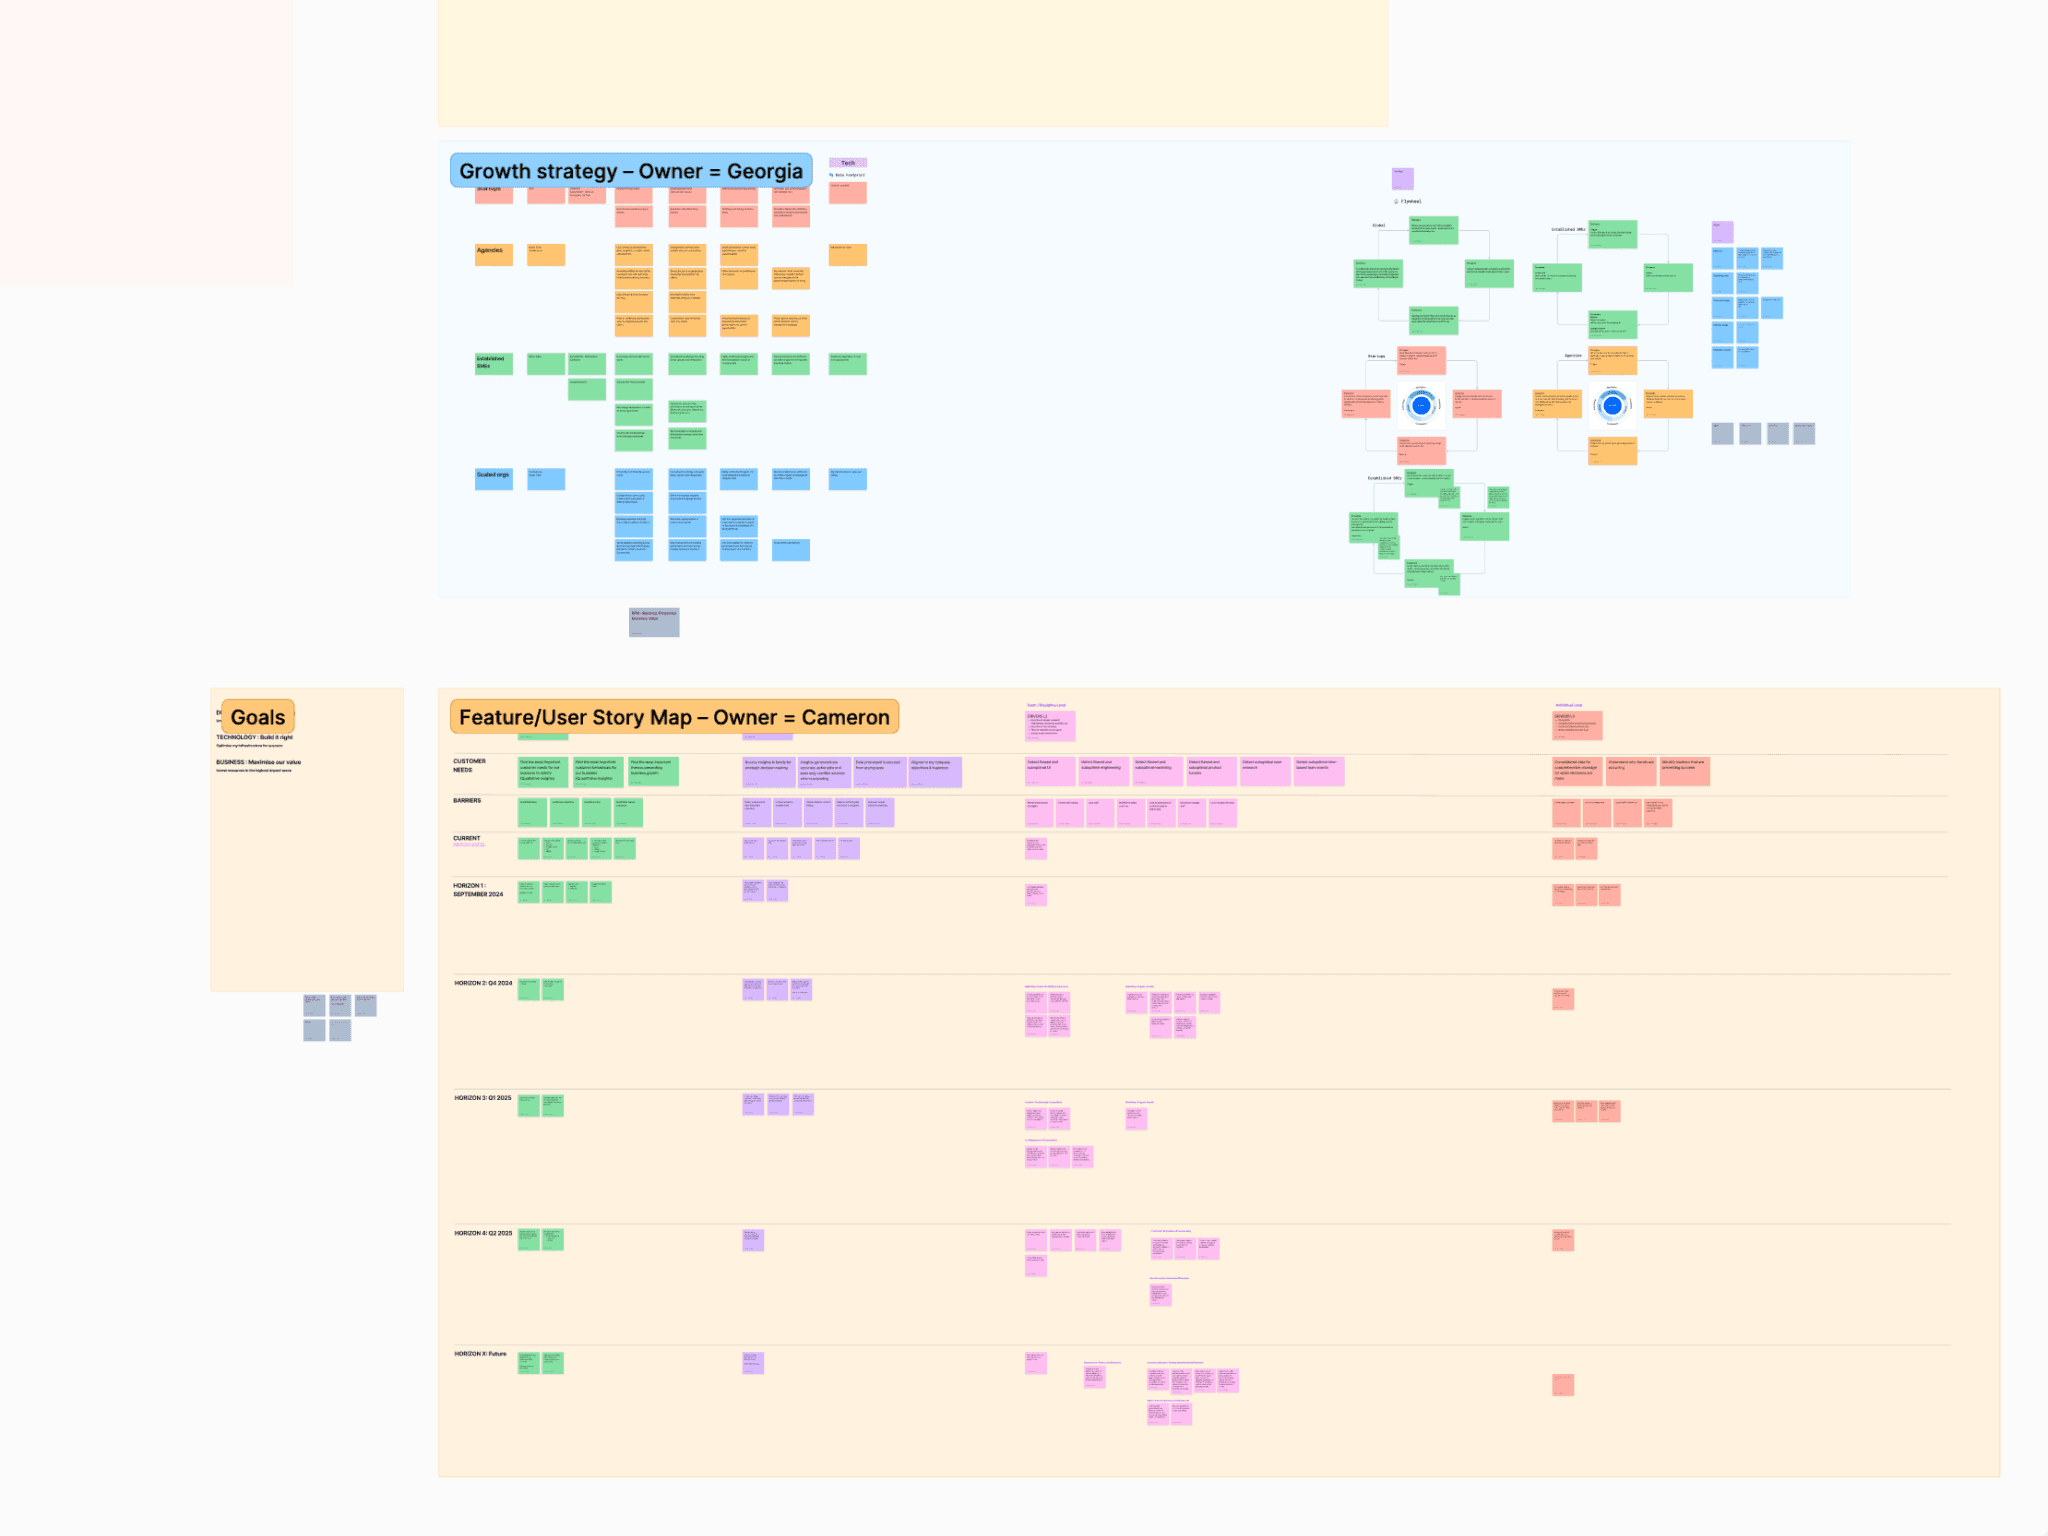
There's nothing dramatic about how it ended. No blowup, no conflict. We simply couldn't sustain it any longer. The technology we'd built, the data we'd collected, and the ontological model Tara developed — the real value of a tech startup lives in its data, not its product. We didn't have enough of either.
What Carries Forward
Despite the outcome, I wouldn't be where I am without Strike. When you're spending your own money, you develop a fundamentally different relationship with waste. Every assumption that goes unvalidated is money burning. Every week spent building without testing is a week you can't afford. That pressure produced a methodology I now apply everywhere.
At Emesent, I do things differently because of Strike. I take multiple concepts out to customers in rapid cycles rather than testing one thing at a time. I use prototypes as instruments to collect data, not to validate a solution. Sometimes the prototype reveals an insight the customer never anticipated — those moments are where the real direction comes from. At Strike, I would have spent weeks building before testing. At Emesent, I spend hours.
The prototype is not the deliverable. The data it collects is the deliverable. That distinction came from Strike.
- Validate with prototypes before building — the cheapest way to be wrong
- Hire contractors with fixed scope before committing to permanent roles
- The gap between insight and action is where most products fail — design for the action, not the insight
- Sales experience on the founding team is non-negotiable, not optional
- When VCs give contradictory advice, the answer is usually that you haven't validated enough to know which one is right
- Speed of iteration compounds — five fast cycles beat one thorough one, every time