Loading...
Currently in
Australia

Cameron Henkes
Available 1 March 2026
Currently in
The data analytics space is incredibly fragmented. The challenge we had to tackle was connecting insights that lived in completely separate systems:

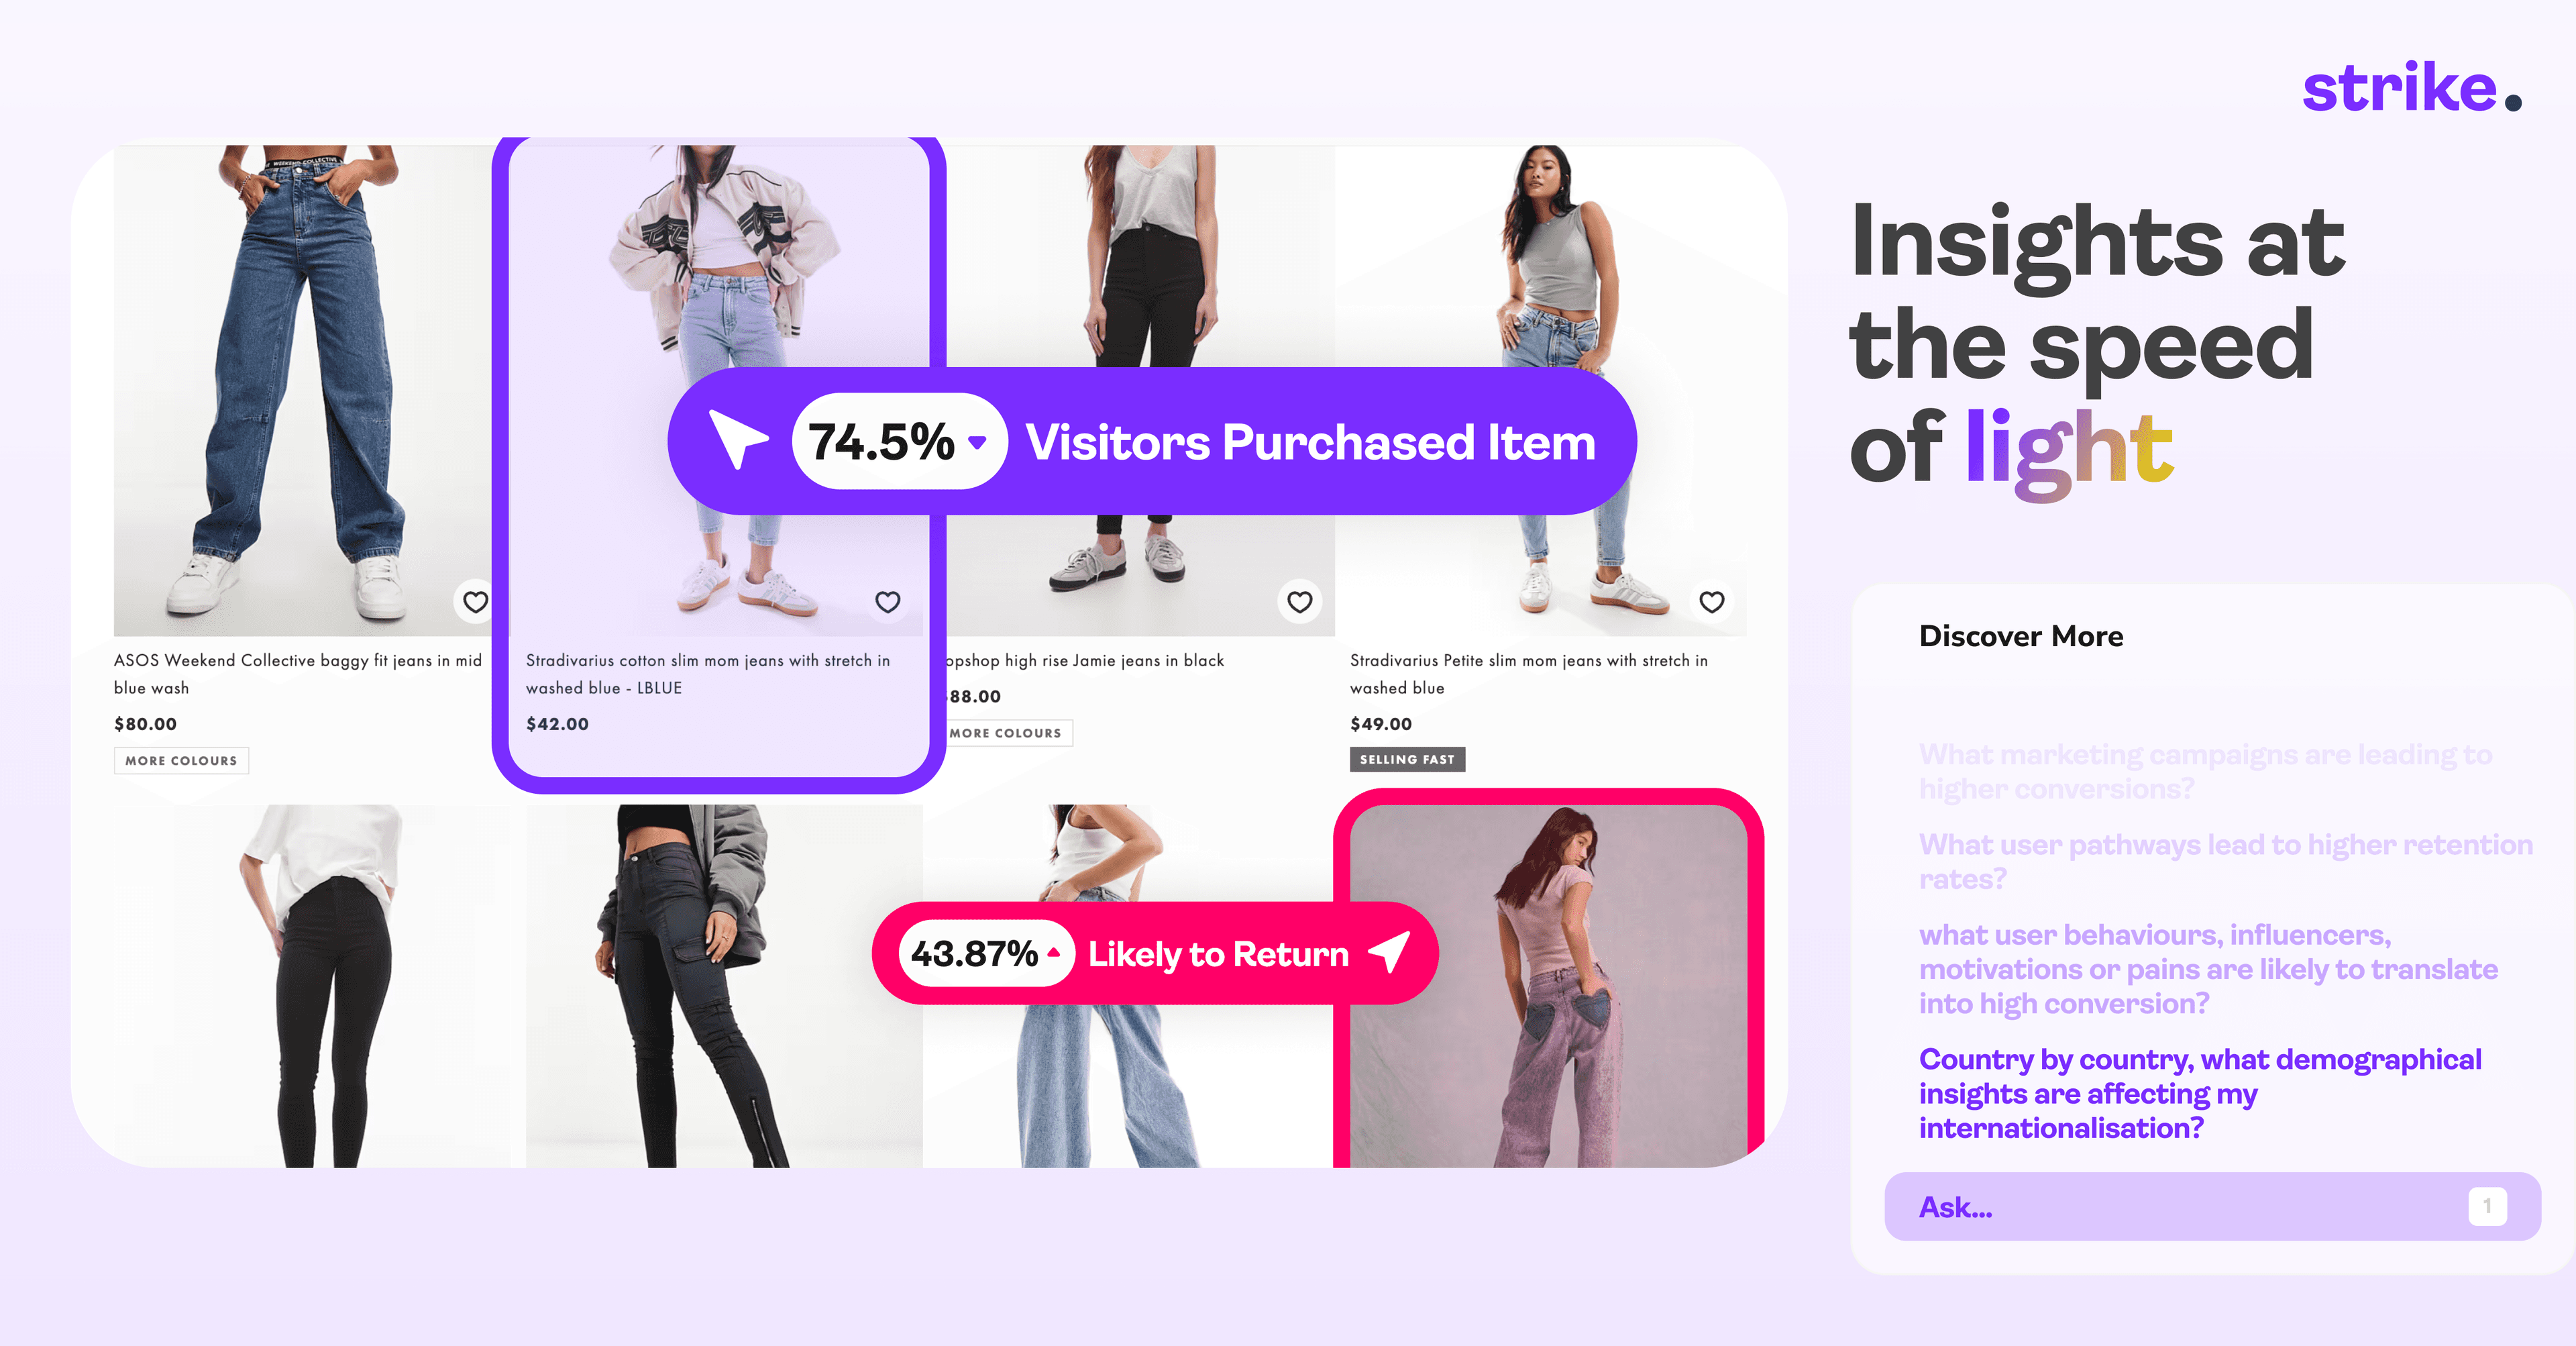
We built an AI framework that automatically cross-compared qualitative insights with quantitative metrics, revealing the psychological drivers behind user behaviour patterns. Rather than replacing human analysis, we augmented it with machine learning that could spot connections humans would miss.
After conducting interviews with over 50 people across 20+ cities globally and running multiple experiments, we evolved our technical approach. We wanted to learn what actually worked rather than building what we thought should work.

Teams spent 24+ hours manually gathering data from different sources, creating spreadsheets, and trying to find correlations through gut feel and basic statistical analysis.
After understanding how businesses actually made data-driven decisions, our AI system could cross-examine multiple data sources and surface actionable insights in under 1 hour, with clear confidence indicators and suggested next steps.

What we delivered transformed how teams approached data analysis:
AI analytics requires a completely different approach than traditional dashboards. You're not just showing data - you're making recommendations that affect business strategy and resource allocation.
Every algorithmic decision had to be explainable. We couldn't just tell users what to do; we had to show them why our AI reached those conclusions.


When I started Strike, most analytics tools were either too simple (basic reporting) or too complex (requiring data science teams). There was nothing that bridged business strategy with technical implementation.
So I developed our "10 inches deep vs. 10 inches wide" approach - focusing deeply on specific data types before expanding to related areas.
Working with our data science team, I architected a system combining multiple machine learning approaches:
The key insight was using these models together rather than in isolation. Each algorithm validated and enriched the others' findings.
To ensure our AI recommendations were reliable, I developed a benchmark system using historical data where we already knew the outcomes. This let us fine-tune our models against real business results rather than theoretical accuracy.
We tested every new model version against these benchmarks before releasing updates, maintaining prediction accuracy while improving speed.
We instrumented everything to understand how teams actually used our insights. The data revealed something crucial: people would look at our analysis, say "that's interesting," then do nothing.
This led to our biggest pivot - evolving from analytics to automation. Instead of just showing insights, we built systems that could automatically implement personalised experiences based on what we discovered.

Managing teams across Sydney, Singapore, Cairo, and Berlin required new approaches to alignment and communication. I developed a storytelling-based methodology where every technical decision connected back to our core mission of making data accessible to anyone.
Daily video updates helped maintain alignment across time zones, and I made sure everyone understood not just what we were building, but why each feature mattered for our users' success.
This project taught me that the future of analytics isn't about bigger dashboards or more sophisticated algorithms - it's about making complex data insights immediately actionable. The companies that succeed will be those that can turn data analysis from a periodic exercise into a continuous, automated process that informs every business decision in real-time.
Our platform delivered actionable insights across all platforms, enabling decision-makers to stay informed no matter where they are.
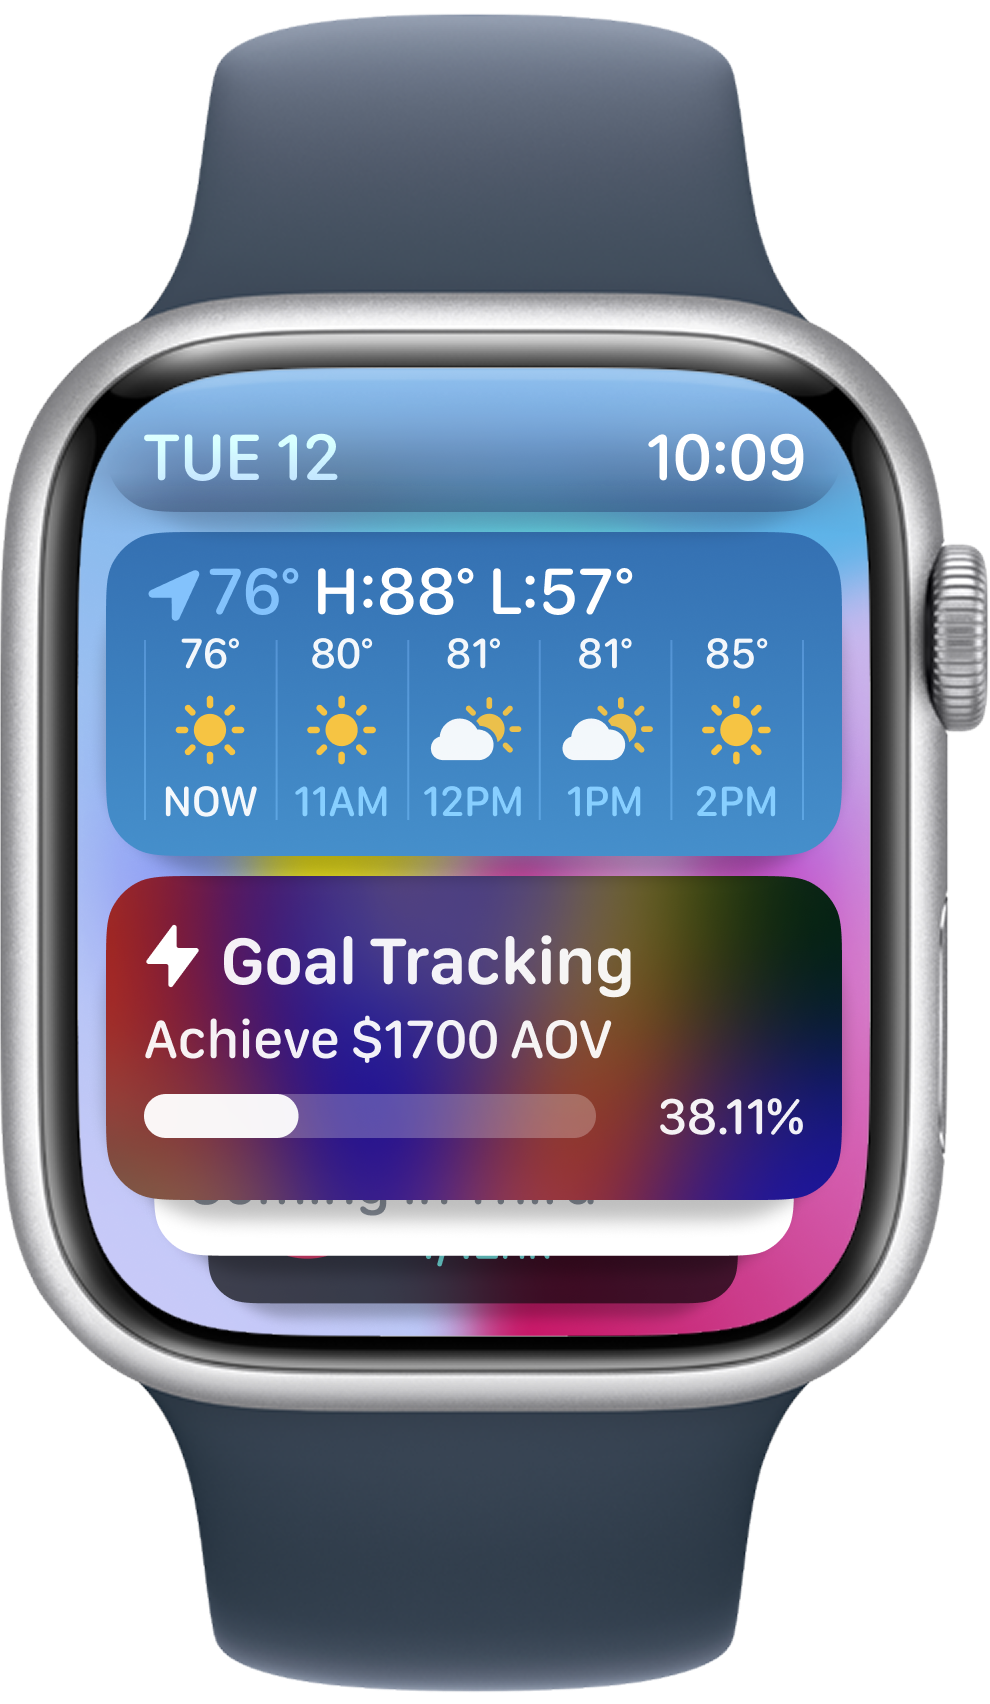
Quick insights dashboard for monitoring key metrics on the go.